 Back
Polynomial and Rational Functions: Graphs, Properties, and Modeling
Study Guide - Smart Notes
 Tailored notes based on your materials, expanded with key definitions, examples, and context.
Polynomial and Rational Functions
Function Families and Power Functions
Polynomial and rational functions are fundamental in precalculus, providing models for a wide range of real-world phenomena. Understanding their graphs, properties, and transformations is essential for further study in mathematics.
Graphs of Power Functions
Power functions have the form f(x) = ax^n, where a and n are constants. The behavior of these functions depends on the value and parity (even or odd) of the exponent n:
Even powers (e.g., x2, x4): The graph is symmetric about the y-axis and opens upward if a > 0, downward if a < 0.
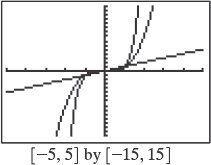
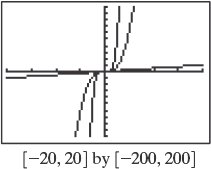
Odd powers (e.g., x3, x5): The graph is symmetric about the origin and passes through the origin, increasing from bottom left to top right if a > 0.
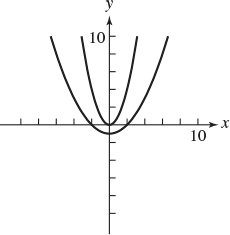
As the degree increases, the graph becomes steeper near the origin and flatter further away.
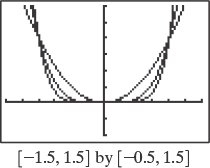
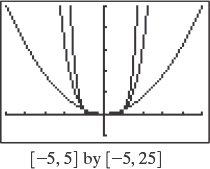
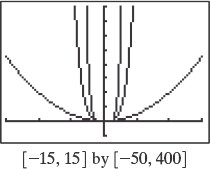
Graphs of Odd Power Functions
Odd power functions exhibit different end behavior compared to even powers. As x approaches positive or negative infinity, the function values also approach positive or negative infinity, but in opposite directions.
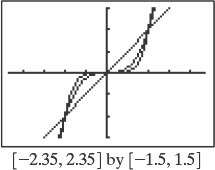
Linear Functions and Their Graphs
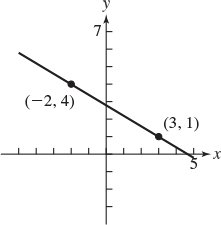
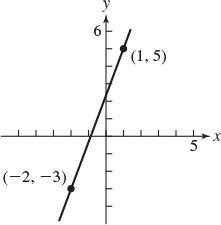
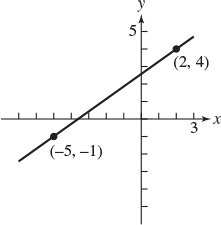
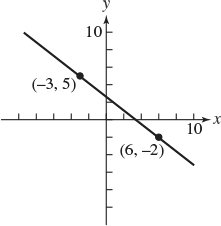
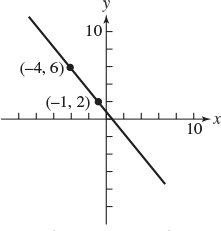
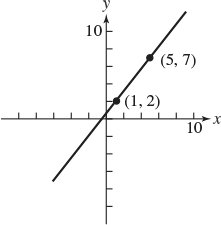
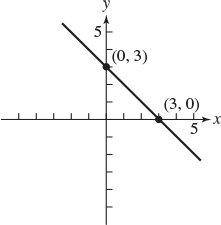
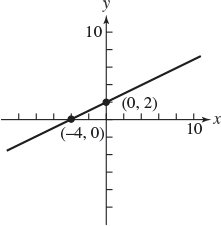
Linear functions have the form f(x) = mx + b, where m is the slope and b is the y-intercept. The graph is a straight line, and the slope determines the steepness and direction of the line.
Positive slope: Line rises from left to right.
Negative slope: Line falls from left to right.
Zero slope: Horizontal line.
Given two points, the slope is calculated as:
Quadratic Functions and Their Graphs
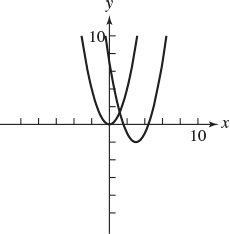
Quadratic functions have the form f(x) = ax^2 + bx + c. Their graphs are parabolas, which open upward if a > 0 and downward if a < 0. The vertex is the maximum or minimum point, and the axis of symmetry passes through the vertex.
Vertex form: where (h, k) is the vertex.
Standard form:
Transformations such as vertical stretching, shrinking, and shifting affect the shape and position of the parabola.
Scatterplots and Linear Regression
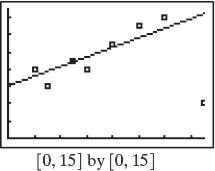
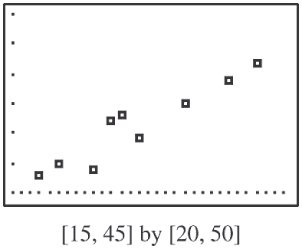
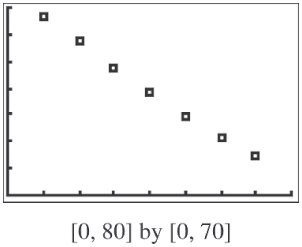
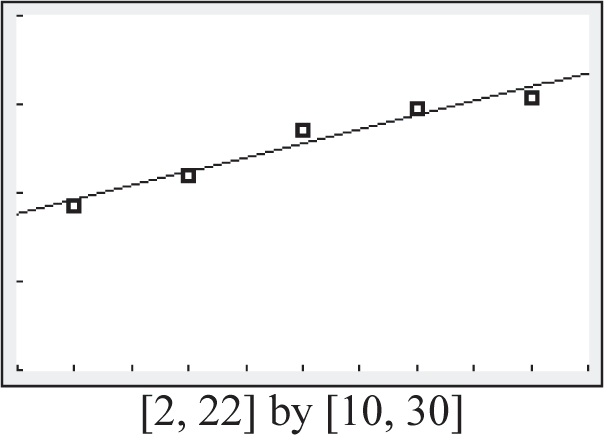
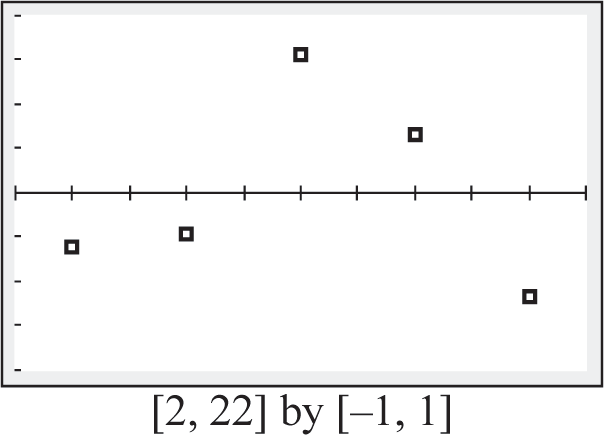
Scatterplots are used to visualize the relationship between two variables. A line of best fit (regression line) can be drawn to model the trend in the data. The strength and direction of the association are measured by the correlation coefficient r:
r > 0: Positive association
r < 0: Negative association
|r| close to 1: Strong association
|r| close to 0: Weak or no association
Quadratic Modeling and Maximum/Minimum Problems
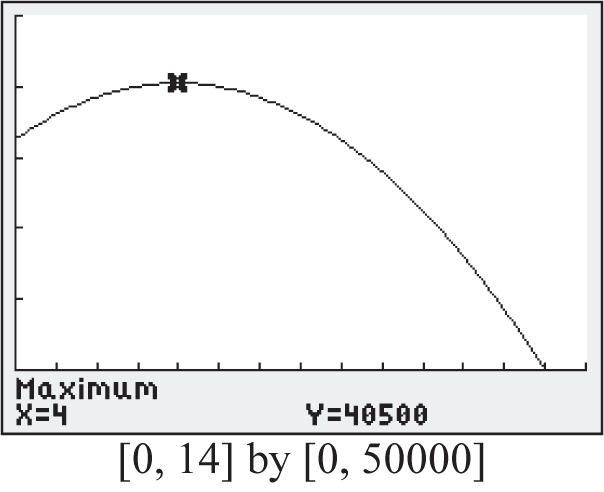
Quadratic functions are often used to model situations involving maximum or minimum values, such as projectile motion or revenue optimization. The vertex of the parabola gives the maximum or minimum value of the function.
For a quadratic function , the vertex is at .
Summary Table: Key Properties of Power and Linear Functions
Function Type | General Form | Graph Shape | Key Properties |
|---|---|---|---|
Linear | f(x) = mx + b | Straight line | Constant rate of change (slope); y-intercept at (0, b) |
Quadratic | f(x) = ax^2 + bx + c | Parabola | Vertex at ; axis of symmetry; opens up/down |
Power (even n) | f(x) = ax^n, n even | U-shaped | Symmetric about y-axis; opens up/down |
Power (odd n) | f(x) = ax^n, n odd | S-shaped | Symmetric about origin; passes through (0,0) |
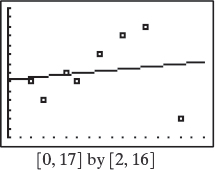
Additional info: The included images illustrate the effect of changing the degree and window size on the appearance of power functions, as well as the interpretation of linear and quadratic models in data analysis.
