 Back
BackPolynomial Functions and Their Graphs: Study Notes for Precalculus
Study Guide - Smart Notes
 Tailored notes based on your materials, expanded with key definitions, examples, and context.
Polynomial Functions and Models
Definition and Degree of Polynomial Functions
A polynomial function is a function of the form:
Coefficients are real numbers.
Degree is a nonnegative integer and is the highest power of with a nonzero coefficient.
Domain: All real numbers ().
The graph of a polynomial function is always smooth and continuous (no breaks, holes, or sharp corners).
Example: is a polynomial of degree 3.
Identifying Polynomial Graphs
Polynomial graphs are smooth and continuous.
They do not have jumps, holes, or sharp corners.
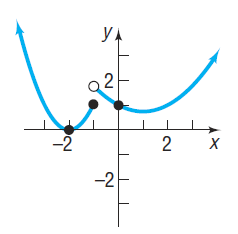
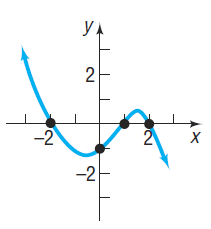
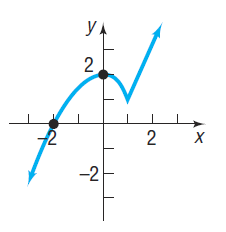
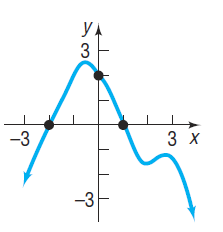
Note: Only graphs that are smooth and continuous without holes or sharp turns can represent polynomial functions.
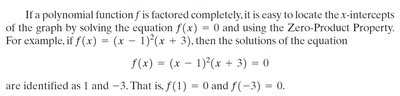
Zeros of Polynomial Functions and Their Multiplicity
Definition of a Zero
If is a zero of , then:
is a solution to
is an x-intercept of the graph
is a factor of
Example: If , then the zeros are (multiplicity 2) and (multiplicity 1).
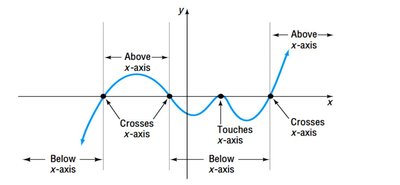
Multiplicity of Zeros
If is a factor and is not, then is a zero of multiplicity .
Multiplicity | Sign Change | Graph Behavior at |
|---|---|---|
1 | Changes sign | Crosses the x-axis |
Even | Same sign | Touches the x-axis |
Odd () | Changes sign | Touches & crosses the x-axis (flattens) |
Turning Points and End Behavior
Turning Points
A turning point is where the graph changes direction (from increasing to decreasing or vice versa).
If is a polynomial of degree , it has at most turning points.
If a graph has turning points, the degree is at least .
End Behavior of Polynomial Functions
The end behavior of is determined by the leading term .
Degree | Leading Coefficient | End Behavior as | End Behavior as |
|---|---|---|---|
Even | Positive | ||
Even | Negative | ||
Odd | Positive | ||
Odd | Negative |
Analyzing the Graph of a Polynomial Function
Step-by-Step Analysis
Find the degree of the polynomial.
Find the x- and y-intercepts by solving and evaluating .
Find zeros and their multiplicities to determine if the graph crosses or touches the x-axis at each zero.
Determine the number of turning points (at most for degree ).
Analyze end behavior using the leading term.
Sketch the graph using all the above information.
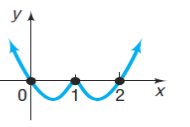
Example:
Degree: (quartic)
Zeros: (mult. 1, crosses), (mult. 2, touches), (mult. 1, crosses)
Turning points: At most
End behavior: Leading coefficient positive, even degree: both ends up
Extra Exercises and Applications
Identify which graphs could be polynomial functions and state the least possible degree.
Construct polynomial functions from given graphs and intercepts.
Analyze polynomial functions using the six-step process above.
Summary Table: Key Properties of Polynomial Functions
Property | Description |
|---|---|
Degree | Highest power of with a nonzero coefficient |
Zeros | Values of where |
Multiplicity | Number of times a zero is repeated |
Turning Points | At most for degree |
End Behavior | Determined by leading term |
Graph Shape | Smooth and continuous |
Additional info: These notes are based on standard precalculus curriculum and include expanded explanations, examples, and tables for clarity.
