 Back
BackPolynomial Functions: Structure, Properties, and Graphs
Study Guide - Smart Notes
 Tailored notes based on your materials, expanded with key definitions, examples, and context.
Polynomial Functions
Definition and Structure of Polynomial Functions
Polynomial functions are a fundamental class of functions in precalculus, defined by expressions involving powers of a variable with real coefficients. Understanding their structure is essential for analyzing their behavior and graphs.
Definition: A polynomial function in one variable is a function of the form , where are real numbers (coefficients), is a nonnegative integer (the degree), and .
Leading Term: The term is called the leading term, and is the leading coefficient.
Constant Term: The term is the constant term.
Degree: The degree of a polynomial function is the largest exponent of with a nonzero coefficient.
Standard Form: A polynomial is in standard form when its terms are written in descending order of degree.
Domain: The domain of any polynomial function is the set of all real numbers.
Example: is a polynomial of degree 5, leading term , constant term .
Non-Example: is not a polynomial function because the exponent is not a nonnegative integer.
Properties of Polynomial Graphs
The graphs of polynomial functions have distinctive characteristics that set them apart from other types of functions.
Smoothness: The graph is smooth (no sharp corners or cusps).
Continuity: The graph is continuous (no gaps or holes; can be drawn without lifting your pencil).
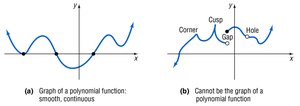
Additional info: Non-polynomial graphs may have corners, cusps, gaps, or holes, which are not present in polynomial graphs.
Power Functions
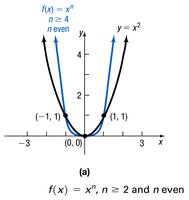
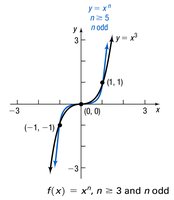
A power function is a special type of polynomial function with only one term: , where is a real number and is a positive integer.
If is even, the graph is symmetric about the y-axis (even function).
If is odd, the graph is symmetric about the origin (odd function).
For both, the graph passes through , , and .
As increases, the graph becomes steeper; near the origin, it flattens out.
Graphing Polynomial Functions Using Transformations
Transformations of Polynomial Graphs
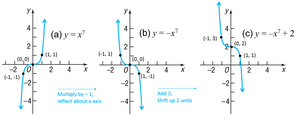
Polynomial graphs can be manipulated using transformations such as stretching, reflecting, and shifting. These transformations help in sketching complex polynomial functions based on simpler ones.
Vertical Stretch/Compression: Multiplying by a constant stretches () or compresses () the graph vertically.
Reflection: Multiplying by reflects the graph about the x-axis.
Horizontal Shift: Replacing with shifts the graph left by units; with , right by $h$ units.
Vertical Shift: Adding shifts the graph up by $k$ units; subtracting $k$, down by $k$ units.
Zeros of Polynomial Functions and Their Multiplicity
Real Zeros and the Zero-Product Property
The real zeros of a polynomial function are the values of for which . These correspond to the x-intercepts of the graph. If the polynomial is factored, zeros can be found using the zero-product property.
If , then are the real zeros.
The multiplicity of a zero is the exponent of the factor .
Interpretation:
If is odd, the graph crosses the x-axis at .
If is even, the graph touches the x-axis at but does not cross.
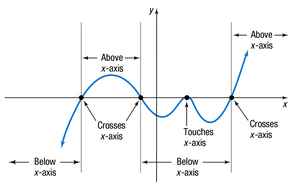
Example: Finding a Polynomial from Its Zeros
Given zeros , a degree 4 polynomial can be written as , where .
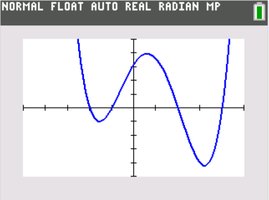
Graphing Using x-Intercepts and Multiplicity
To sketch a polynomial graph:
Find the y-intercept ().
Find the x-intercepts (solve ).
Determine the multiplicity of each zero to predict whether the graph crosses or touches the x-axis.
Test points in intervals between zeros to determine if the graph is above or below the x-axis.
Connect points with a smooth, continuous curve.
Turning Points and End Behavior
Turning Points
Turning points are points where the graph changes direction (from increasing to decreasing or vice versa). Each turning point is a local maximum or minimum.
A polynomial of degree has at most turning points.
End Behavior of Polynomial Functions
The end behavior of a polynomial function describes how the function behaves as or . The leading term determines the end behavior.
Degree | Leading Coefficient | End Behavior |
|---|---|---|
Even | Positive | as ; $f(x) \to \infty$ as |
Even | Negative | as ; $f(x) \to -\infty$ as |
Odd | Positive | as ; as |
Odd | Negative | as ; as |
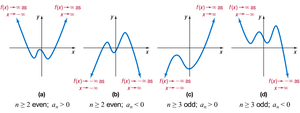
Identifying and Writing Polynomial Functions from Graphs
Criteria for Polynomial Graphs
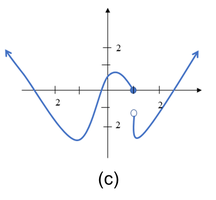
To determine if a graph could represent a polynomial function, check for smoothness and continuity. Count the number of real zeros and turning points to estimate the minimum degree.
Not a polynomial graph: If the graph has a cusp, corner, gap, or hole.
Degree estimation: The number of turning points is at most one less than the degree.
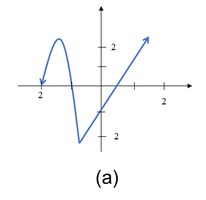
Writing a Polynomial from a Graph
Given the x-intercepts and the behavior at each (crosses or touches), construct the polynomial using factors and assign the lowest possible degree consistent with the graph's turning points and end behavior.
Summary Table: Key Properties of Polynomial Functions
Property | Description |
|---|---|
Degree | Largest exponent of |
y-intercept | Value at |
Turning Points | At most for degree |
Zeros (x-intercepts) | Where |
Multiplicity | Even: touches x-axis; Odd: crosses x-axis |
End Behavior | Determined by leading term |
Domain | All real numbers |
