 Back
Polynomial Functions: Structure, Zeros, and Graphs
Study Guide - Smart Notes
 Tailored notes based on your materials, expanded with key definitions, examples, and context.
Polynomial Functions
Definition of a Polynomial Function
A polynomial function is a function of the form , where is a nonnegative integer and are real numbers. The degree of the polynomial is , and the leading coefficient is .
Degree: The highest power of in the polynomial.
Leading Coefficient: The coefficient of the term with the highest degree.
Constant Term: The term with no variable.
Example: is a cubic polynomial (degree 3) with leading coefficient 2.
Graphs of Polynomial Functions – Smooth and Continuous
The graph of a polynomial function of degree 2 or higher is smooth (no sharp corners) and continuous (no breaks; can be drawn without lifting the pencil).
Graphs contain only rounded curves.
No gaps or jumps in the graph.
End Behavior of Polynomial Functions
The end behavior describes how the graph behaves as approaches positive or negative infinity. The sign of the leading coefficient and the degree of the polynomial determine this behavior.
Even degree, positive leading coefficient: Both ends rise.
Even degree, negative leading coefficient: Both ends fall.
Odd degree, positive leading coefficient: Left end falls, right end rises.
Odd degree, negative leading coefficient: Left end rises, right end falls.
Example: For , both ends rise since degree is even and leading coefficient is positive.
The Leading Coefficient Test
The Leading Coefficient Test helps predict the end behavior of a polynomial function:
If is even and , as .
If is even and , as .
If is odd and , as , as .
If is odd and , as , as .
Zeros of Polynomial Functions
The zeros of a polynomial function are the values of for which . These are also called roots or solutions of the polynomial equation. Each real zero corresponds to an x-intercept on the graph.
To find zeros, set and solve for .
Factoring is a common method for finding zeros.
Example: For , set and factor to , so zeros are and .
Multiplicity and x-Intercepts
The multiplicity of a zero refers to how many times a particular root appears in the factorization of the polynomial.
If is a zero of even multiplicity, the graph touches the x-axis at and turns around.
If is a zero of odd multiplicity, the graph crosses the x-axis at .
Graphs flatten out near zeros with multiplicity greater than one.
Example: For , has multiplicity 2 (touches and turns), has multiplicity 1 (crosses).
Turning Points of Polynomial Functions
A turning point is where the graph changes direction from increasing to decreasing or vice versa. For a polynomial of degree , the graph has at most turning points.
Degree 3: at most 2 turning points.
Degree 4: at most 3 turning points.
Graphing a Polynomial Function: 3-Step Strategy
To graph a polynomial function, follow these steps:
Determine end behavior: Use the Leading Coefficient Test.
Find x-intercepts: Solve and determine multiplicities.
Find the y-intercept: Compute .
Example: For :
Degree is 3 (odd), leading coefficient is 2 (positive): left end falls, right end rises.
(multiplicity 2): graph touches and turns at .
(multiplicity 1): graph crosses at .
Find y-intercept: .
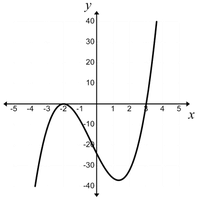
Additional info: The graph above illustrates a cubic polynomial with two x-intercepts, one of which is a double root (touches and turns), and the other a single root (crosses). The end behavior matches the prediction for an odd-degree, positive leading coefficient polynomial.
