 Back
Precalculus: Instantaneous and Average Rate of Change Study Guide
Study Guide - Smart Notes
 Tailored notes based on your materials, expanded with key definitions, examples, and context.
Q1. Is increasing or decreasing at ? How do you know?
Background
Topic: Increasing/Decreasing Functions
This question tests your understanding of how to determine whether a function is increasing or decreasing at a specific point by analyzing the graph or the derivative at that point.
Key Terms and Concepts:
Increasing function: The function's output values are getting larger as increases.
Decreasing function: The function's output values are getting smaller as increases.
Slope of the tangent: The sign of the slope at a point tells you if the function is increasing (positive slope) or decreasing (negative slope).
Step-by-Step Guidance
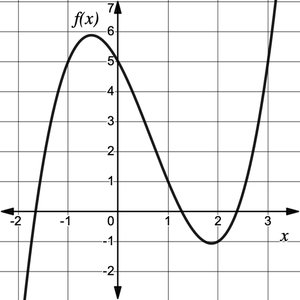
Locate on the graph of .
Observe the behavior of the graph at this point: is it moving upward or downward as you move from left to right?
Consider the slope of the tangent line at . If the tangent slopes downward, is decreasing; if it slopes upward, is increasing.
Use the visual information from the graph to decide whether the function is increasing or decreasing at .
Try solving on your own before revealing the answer!
Final Answer:
is decreasing at because the graph is sloping downward at that point (the tangent line has a negative slope).
Q2. Is the rate of change of increasing or decreasing at ? How do you know?
Background
Topic: Concavity and Rate of Change
This question is about understanding how the rate of change (the derivative) itself is changing, which relates to the second derivative and the concept of concavity.
Key Terms and Concepts:
Rate of change: The slope of the tangent line (first derivative).
Increasing rate of change: The slope is becoming less negative or more positive (second derivative is positive).
Decreasing rate of change: The slope is becoming more negative or less positive (second derivative is negative).
Concavity: If the graph is concave up, the rate of change is increasing; if concave down, the rate of change is decreasing.
Step-by-Step Guidance
Look at the graph near and observe the shape (concavity) of the curve.
If the graph is curving downward (like an upside-down bowl), it is concave down; if it curves upward (like a right-side-up bowl), it is concave up.
Recall: Concave down means the rate of change is decreasing; concave up means the rate of change is increasing.
Use the graph to determine the concavity at and thus whether the rate of change is increasing or decreasing.
Try solving on your own before revealing the answer!
Final Answer:
The rate of change of is decreasing at because the graph is concave down at that point (the second derivative is negative).
Q3. On which interval of the domain is the graph of concave down?
Background
Topic: Concavity of Functions
This question asks you to identify where the graph is concave down, which is where the second derivative is negative.
Key Terms and Concepts:
Concave down: The graph bends downward, like an upside-down bowl.
Second derivative: If , the function is concave down at .
Step-by-Step Guidance
Examine the graph and look for intervals where the curve bends downward.
Identify the -values where the concavity changes (possible inflection points).
Mark the interval(s) where the graph is concave down between these points.
Try solving on your own before revealing the answer!
Final Answer:
The graph of is concave down on the interval approximately , where the curve bends downward.
Q4. On which interval of the domain is the graph of concave up?
Background
Topic: Concavity of Functions
This question is the counterpart to the previous one, asking for where the graph is concave up (second derivative positive).
Key Terms and Concepts:
Concave up: The graph bends upward, like a right-side-up bowl.
Second derivative: If , the function is concave up at .
Step-by-Step Guidance
Look for intervals on the graph where the curve bends upward.
Identify the -values where the concavity changes (inflection points).
Mark the interval(s) where the graph is concave up between these points.
Try solving on your own before revealing the answer!
Final Answer:
The graph of is concave up on the interval approximately , where the curve bends upward.
Q5. Estimate the -value of the point of inflection. Describe what this point tells you about how is changing.
Background
Topic: Inflection Points
This question is about finding where the concavity of the function changes, which is called a point of inflection.
Key Terms and Concepts:
Point of inflection: A point where the graph changes concavity (from up to down or down to up).
Second derivative: At a point of inflection, changes sign.
Step-by-Step Guidance
Examine the graph and look for the -value where the curve changes from concave down to concave up (or vice versa).
Estimate the -coordinate of this point by observing where the curve's bending direction changes.
Describe what happens to the rate of change of at this point (the slope of the tangent changes from decreasing to increasing or vice versa).
Try solving on your own before revealing the answer!
Final Answer:
The point of inflection is approximately at . At this point, the concavity of changes from down to up, meaning the rate of change of switches from decreasing to increasing.
Q6. Values for the rate of change of at the 5 values given in the table are -4.25, -3, 1, 4, and 9.75. Fill in the table below to match each rate of change with the -value where it occurs.
Background
Topic: Interpreting Derivative Values from a Graph
This question asks you to match the given rates of change (slopes) to specific -values by analyzing the graph at those points.
Key Terms and Concepts:
Rate of change: The slope of the tangent line at a given -value.
Positive/negative values: Positive slope means increasing, negative means decreasing.
Magnitude: Larger absolute values mean steeper slopes.
Step-by-Step Guidance
For each -value in the table (), look at the graph and estimate the slope of the tangent line at that point.
Match the most negative value to the point where the graph is steepest downward, and the most positive value to the steepest upward.
Assign the remaining values based on the relative steepness and direction of the tangent at each -value.
Fill in the table accordingly, but do not reveal the final matching yet.
Try solving on your own before revealing the answer!
Final Answer:
Matching the rates of change to -values (from steepest negative to steepest positive): - : : - : $1x = 0.5 - :
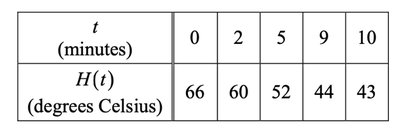
Q7a. The temperature of a pot of tea as it is cooling is given by the function , measured in °Celsius. Time, , is measured in minutes. How fast is the tea cooling, on average, over the ten-minute interval? Show work and include units.
Background
Topic: Average Rate of Change from a Table
This question tests your ability to calculate the average rate of change of a function over an interval using values from a table.
Key Formula:
Average rate of change over :
Where:
= value of the function at the start of the interval
= value of the function at the end of the interval
= length of the interval (in minutes)
Step-by-Step Guidance
Identify the starting and ending values from the table: and .
Subtract the final temperature from the initial temperature: .
Divide this difference by the length of the interval: minutes.
Set up the average rate of change formula, but do not compute the final value yet.
Try solving on your own before revealing the answer!
Final Answer:
The average rate of change is degrees Celsius per minute. The negative sign indicates the temperature is decreasing.
