 Back
BackPrecalculus Study Guide: Graphs and Functions
Study Guide - Smart Notes
 Tailored notes based on your materials, expanded with key definitions, examples, and context.
Section 1.5: Graphs of Lines
Understanding the Slope and Equation of a Line
This section introduces the fundamental concepts of lines in the coordinate plane, focusing on slope, equations, and their graphical representations.
Slope of a Line: The slope measures the steepness and direction of a line. It is calculated as the ratio of the change in y to the change in x between two points:
Point-Slope Form: The equation of a line given a point and slope is:
Slope-Intercept Form: The equation of a line with slope and y-intercept is:
Horizontal and Vertical Lines:
Horizontal: (slope )
Vertical: (undefined slope)
Parallel and Perpendicular Lines:
Parallel lines have equal slopes.
Perpendicular lines have slopes that are negative reciprocals:
Graphing Linear Equations: Plot points and use slope to draw the line.
Example:
Find the equation of a line passing through with slope $4$:
Section 2.1: Functions and Their Graphs
Definition and Representation of Functions
This section explores the concept of functions, their notation, and how to represent them graphically and algebraically.
Function: A relation where each input (domain) has exactly one output (range).
Function Notation: denotes the output for input .
Domain and Range:
Domain: Set of all possible input values.
Range: Set of all possible output values.
Graph of a Function: The set of points in the coordinate plane.
Vertical Line Test: A graph represents a function if no vertical line intersects it more than once.
Example:
Is a function? Yes, because each has one value.
Section 2.2: Graphs of Functions
Interpreting and Sketching Function Graphs
This section focuses on identifying and analyzing the graphs of functions, including transformations and key features.
Identifying Graphs: Recognize common function shapes (linear, quadratic, etc.).
Transformations:
Vertical shifts:
Horizontal shifts:
Reflections: or
Stretching/Compressing:
Key Features:
Intercepts (where graph crosses axes)
Maximum and minimum points
Intervals of increase/decrease
Example:
Sketch and (vertical shift up by 3).
Section 2.3: Linear and Quadratic Functions
Properties and Applications of Linear and Quadratic Functions
This section covers the characteristics, equations, and applications of linear and quadratic functions.
Linear Functions:
General form:
Graph is a straight line.
Quadratic Functions:
General form:
Graph is a parabola.
Vertex:
Axis of symmetry:
Maximum/Minimum:
If , parabola opens upward (minimum at vertex).
If , parabola opens downward (maximum at vertex).
Applications: Used in modeling real-world situations such as projectile motion.
Example:
Find the vertex of :
Section 2.4: Library of Functions and Graphs
Common Functions and Their Graphs
This section introduces basic functions frequently used in precalculus and their graphical representations.
Linear Function:
Quadratic Function:
Cubic Function:
Square Root Function:
Absolute Value Function:
Graphing: Recognize the shape and key points of each function.
Example:
Graph ; it forms a 'V' shape with vertex at .
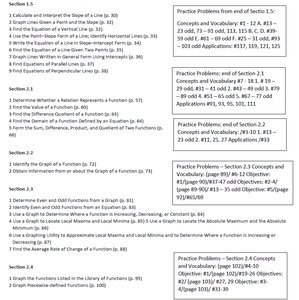
Practice Problems and Objectives
Review and Practice for Mastery
Practice problems are provided for each section to reinforce understanding and prepare for exams. These include concept checks, vocabulary, and application exercises.
Section 1.5: Slope, equations of lines, graphing, parallel/perpendicular lines
Section 2.1: Functions, domain/range, vertical line test
Section 2.2: Graphs, transformations, key features
Section 2.3: Linear/quadratic functions, maximum/minimum, applications
Section 2.4: Library of functions, graphing basic functions
Additional info: Practice problems are referenced by textbook section and include odd/even numbered exercises, concept and vocabulary checks, and application questions. These are essential for exam preparation and mastery of precalculus fundamentals.
