 Back
BackPrecalculus Study Guide: Graphs, Functions, and Analytic Geometry
Study Guide - Smart Notes
 Tailored notes based on your materials, expanded with key definitions, examples, and context.
Graphs and Functions
Graphs of Equations and Coordinates
The Cartesian coordinate system is fundamental in precalculus for graphing equations and analyzing relationships between variables. Points are plotted using ordered pairs (x, y), and equations can be visualized as geometric shapes.
Ordered Pair: An ordered pair (x, y) represents a point in the plane, where x is the horizontal coordinate and y is the vertical coordinate.
Distance Formula: The distance between two points (x1, y1) and (x2, y2) is given by:
Midpoint Formula: The midpoint between two points is:
Circle Equation: The equation of a circle with center (h, k) and radius r is:
Example: Find the distance between (2, 3) and (5, 7):
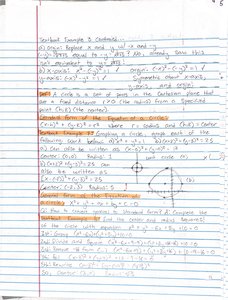
Graphing Equations
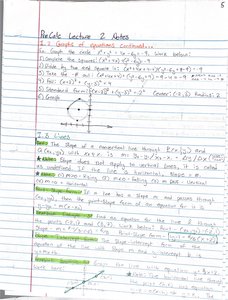
Graphing equations involves plotting points that satisfy the equation and identifying the shape formed. Common shapes include lines, circles, and parabolas.
Intercepts: The x-intercept is where the graph crosses the x-axis (y = 0), and the y-intercept is where it crosses the y-axis (x = 0).
Symmetry: Test for symmetry about the x-axis, y-axis, and origin by substituting values and checking if the equation remains unchanged.
Analytic Geometry
Lines and Their Equations
Lines are described algebraically by their equations and geometrically by their slope and intercepts. Understanding the forms of line equations is essential for solving geometric problems.
Slope Formula: The slope m of a line passing through (x1, y1) and (x2, y2) is:
Point-Slope Form:
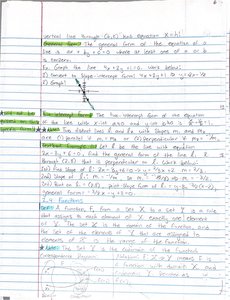
Slope-Intercept Form:
General Form:
Vertical Line:
Horizontal Line:
Example: Find the equation of the line passing through (1, 2) with slope 3:
Parallel and Perpendicular Lines
Parallel lines have equal slopes, while perpendicular lines have slopes that are negative reciprocals of each other.
Parallel Lines: If , the lines are parallel.
Perpendicular Lines: If , the lines are perpendicular.
Functions
Definition and Representation
A function is a relation in which each input (domain) corresponds to exactly one output (range). Functions can be represented as equations, tables, graphs, or mappings.
Domain: The set of all possible input values (x).
Range: The set of all possible output values (y).
Function Notation: denotes the output for input x.
Example: If , then .
Vertical Line Test
The vertical line test is used to determine if a graph represents a function. If any vertical line crosses the graph more than once, it is not a function.
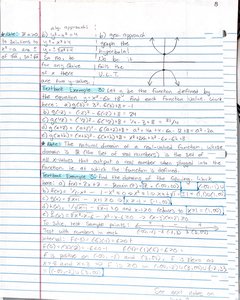
Evaluating Functions
To evaluate a function, substitute the input value into the function's equation.
Example: For , .
Finding Domain and Range
To find the domain, identify all x-values for which the function is defined. To find the range, determine all possible y-values.
Example: For , the domain is all real numbers except .
Summary Table: Forms of Line Equations
The following table summarizes the main forms of line equations and their characteristics:
Form | Equation | Key Feature |
|---|---|---|
Point-Slope | Uses a point and slope | |
Slope-Intercept | Shows slope and y-intercept | |
General | Standard form | |
Vertical | Vertical line | |
Horizontal | Horizontal line |
Summary Table: Function Properties
Property | Description |
|---|---|
Domain | Set of all possible input values |
Range | Set of all possible output values |
Vertical Line Test | Determines if a graph is a function |
Function Notation | represents the output for input x |
Additional info:
Some context and terminology were expanded for clarity and completeness.
Examples and tables were inferred and supplemented to ensure the notes are self-contained and exam-ready.
