 Back
BackPrecalculus Study Guide: Graphs of Functions and Their Properties
Study Guide - Smart Notes
 Tailored notes based on your materials, expanded with key definitions, examples, and context.
Q1. Which of the following are graphs of functions?
Background
Topic: Graphs of Functions and the Vertical Line Test
This question is testing your ability to determine whether a given graph represents a function. The key concept here is that for a relation to be a function, each input (x-value) must correspond to exactly one output (y-value). The vertical line test is a visual way to check this property on a graph.
Key Terms and Formulas
Function: A relation in which each element of the domain (x) is paired with exactly one element of the range (y).
Vertical Line Test: A graph represents a function if and only if no vertical line intersects the graph at more than one point.
Step-by-Step Guidance
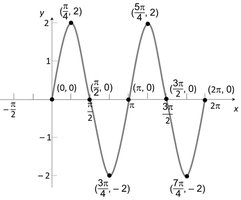
Examine each graph and imagine drawing vertical lines (parallel to the y-axis) at various x-values.
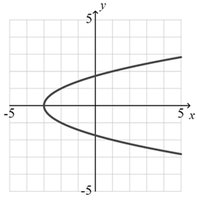
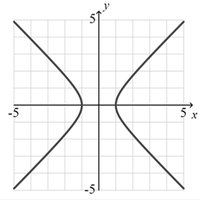
For each graph, check if any vertical line would intersect the graph at more than one point. If so, the graph does not represent a function.
For the graphs that pass the vertical line test, note that for every x-value, there is only one corresponding y-value.
For the graphs that fail the test, identify at least one x-value where the vertical line crosses the graph more than once.
List which graphs are functions and which are not, based on your analysis. (Stop here and try to make your own determination before checking the answer!)
Try solving on your own before revealing the answer!
Final Answer:
Graph (a) (image_1): This is a function. Every vertical line crosses the graph at most once.
Graph (b) (image_2): This is not a function. Some vertical lines (for example, near x = 0) cross the graph twice.
Graph (c) (image_3): This is not a function. Some vertical lines cross the graph twice (for example, near x = 0).
Only graph (a) passes the vertical line test and represents a function.
