 Back
BackPrecalculus Study Guide: Linear and Quadratic Functions, Models, and Inequalities
Study Guide - Smart Notes
 Tailored notes based on your materials, expanded with key definitions, examples, and context.
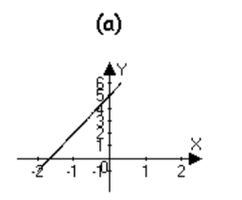
Q1. For each function, (i) determine the slope and y-intercept; (ii) graph the function using slope and y-intercept; (iii) determine the average rate of change; and (iv) determine whether the function is increasing, decreasing, or constant.
(a)
(b)
(c)
Background
Topic: Linear Functions and Their Properties
This question tests your understanding of linear functions, including how to identify their slope and y-intercept, graph them, calculate the average rate of change, and determine their behavior (increasing, decreasing, or constant).
Key Terms and Formulas
Slope (m): The rate at which the function changes as x increases. For , m is the slope.
y-intercept (b): The value of y when .
Average Rate of Change: For a linear function, this is the same as the slope.
Increasing/Decreasing/Constant: Determined by the sign of the slope.
Step-by-Step Guidance
Identify the slope and y-intercept for each function by comparing to the standard form .
Plot the y-intercept on the graph, then use the slope to find another point and draw the line.
Calculate the average rate of change (for linear functions, this is just the slope).
Determine if the function is increasing (positive slope), decreasing (negative slope), or constant (zero slope).
Try solving on your own before revealing the answer!
Q2. Suppose and .
(a) Solve .
(b) Solve .
(c) Solve .
(d) Solve .
Background
Topic: Solving Linear Equations and Inequalities
This question asks you to solve equations and inequalities involving linear functions, including finding where two lines intersect and where one is above or below the other.
Key Terms and Formulas
Solving : Find x where the function crosses the x-axis.
Solving : Set the two functions equal and solve for x (intersection point).
Solving inequalities: Find the set of x-values where the inequality holds.
Step-by-Step Guidance
For (a), set and solve for x.
For (b), solve for x.
For (c), set and solve for x.
For (d), solve for x.
Try solving on your own before revealing the answer!
Q3. The cost, C, in dollars of a cellular phone plan is given by the function , where x is the number of minutes used.
(a) What is the cost of the plan if you talk for 150 minutes?
(b) If the bill is $220, how many minutes were used?
(c) What is the maximum number of minutes that can be used for $120?
Background
Topic: Linear Models and Applications
This question involves applying a linear model to real-world data, interpreting the slope and intercept in context, and solving for unknowns.
Key Terms and Formulas
Linear Model:
Solving for C: Substitute x and compute.
Solving for x: Rearrange the equation to solve for x when C is given.
Step-by-Step Guidance
For (a), substitute into and simplify.
For (b), set and solve for x.
For (c), set and solve for x.
Try solving on your own before revealing the answer!
Q4. An object is propelled straight upward from a height of 6 feet with an initial velocity of 32 feet per second. The height at any time t is given by . Find the maximum height attained by the object.
Background
Topic: Quadratic Functions and Maximum/Minimum Values
This question tests your ability to analyze a quadratic function to find its vertex, which represents the maximum height in this context.
Key Terms and Formulas
Vertex of a parabola: For , the vertex occurs at .
Maximum height: Substitute the vertex value of t back into .
Step-by-Step Guidance
Identify a, b, and c in the quadratic equation.
Calculate to find the time at which the maximum height occurs.
Substitute this value of t back into to find the maximum height.
Try solving on your own before revealing the answer!
Q5. A rancher has 200 feet of fencing to enclose two adjacent rectangular corrals. What dimensions will produce a maximum enclosed area?
Background
Topic: Quadratic Optimization (Applications of Quadratic Functions)
This question involves maximizing the area of a rectangle given a fixed perimeter, a classic optimization problem in precalculus.
Key Terms and Formulas
Perimeter constraint: Express the total fencing in terms of the rectangle's dimensions.
Area function: Write area as a function of one variable using the constraint.
Maximum area: Find the vertex of the quadratic area function.
Step-by-Step Guidance
Let the dimensions of the corrals be x and y. Write the perimeter equation based on the fencing arrangement.
Express y in terms of x using the perimeter equation.
Write the area function in terms of x only.
Find the value of x that maximizes by finding the vertex.
Try solving on your own before revealing the answer!
Q6. The revenue function for a new plasma television is given by . What price, p, should be charged to maximize revenue? What is the maximum revenue?
Background
Topic: Maximizing Quadratic Functions (Revenue Models)
This question asks you to find the price that maximizes revenue, which is the vertex of a downward-opening parabola.
Key Terms and Formulas
Revenue function:
Vertex formula: for
Step-by-Step Guidance
Identify a and b in the quadratic revenue function.
Use the vertex formula to find the price p that maximizes revenue.
Substitute this value of p back into to find the maximum revenue.
Try solving on your own before revealing the answer!
Q7. The following data represent the percentage of the population in a certain country aged 40 or older who do not have a college degree for various age groups. Find a quadratic model that describes the relationship between age and percentage. Use the model to predict the percentage of 53-year-olds that do not have a college degree.
Age, x | 25.4 | 32.4 | 41.3 | 51.3 | 54.5 | 26.1 | 29.8 |
|---|
Background
Topic: Quadratic Regression and Modeling
This question involves fitting a quadratic model to data and using the model to make predictions.
Key Terms and Formulas
Quadratic regression: Finding a quadratic function that best fits the data.
Prediction: Substitute the desired x-value into the model to estimate the percentage.
Step-by-Step Guidance
Use a calculator or software to perform quadratic regression on the data points to find the coefficients a, b, and c.
Write the quadratic model using the coefficients found.
Substitute into to estimate the percentage for 53-year-olds.
Try solving on your own before revealing the answer!
Q8. Solve each inequality:
(a)
(b)
(c)
Background
Topic: Solving Quadratic Inequalities
This question tests your ability to solve inequalities involving quadratic expressions, which often requires factoring and analyzing sign charts.
Key Terms and Formulas
Quadratic inequality: An inequality involving a quadratic expression.
Factoring: Expressing the quadratic as a product of binomials (if possible).
Sign chart: Used to determine where the quadratic is positive or negative.
Step-by-Step Guidance
Rewrite each inequality in standard form (all terms on one side, zero on the other).
Factor the quadratic expression if possible.
Find the roots (where the expression equals zero).
Use a sign chart or test intervals to determine where the inequality holds.
Try solving on your own before revealing the answer!
Q9. Solve where and .
Background
Topic: Quadratic Inequalities and Function Comparison
This question asks you to compare two quadratic functions and find the set of x-values where one is greater than the other.
Key Terms and Formulas
Set up the inequality: becomes .
Combine like terms: Bring all terms to one side to form a single quadratic inequality.
Solve the quadratic inequality: Factor or use the quadratic formula, then test intervals.
Step-by-Step Guidance
Subtract from both sides to get a single quadratic inequality.
Simplify the expression and write in standard form.
Find the roots of the resulting quadratic equation.
Use a sign chart to determine where the inequality is satisfied.
Try solving on your own before revealing the answer!
