 Back
BackPrecalculus Study Notes: Functions and Graphs (Blitzer, Ch. 1)
Study Guide - Smart Notes
 Tailored notes based on your materials, expanded with key definitions, examples, and context.
Functions and Graphs
Rectangular Coordinate System
The rectangular coordinate system, also known as the Cartesian plane, is a two-dimensional plane formed by two perpendicular axes: the horizontal x-axis and the vertical y-axis. Points are plotted as ordered pairs (x, y), where the origin (0, 0) is the intersection of the axes. The plane is divided into four quadrants, numbered counterclockwise starting from the top right.
x-values are positive to the right of the origin and negative to the left.
y-values are positive above the origin and negative below.
Quadrants are labeled I, II, III, IV.
Example: Plot the points A(4, 3), B(−3, 2), C(−2, −3), D(5, −4), E(0, 0), F(0, −3) and identify their quadrants.
Equations of Two Variables
Many equations in precalculus involve two variables, typically x and y. The graph of such an equation is the set of all points (x, y) that satisfy the equation.
To check if a point is on the graph, substitute its x and y values into the equation.
If the equation is true, the point lies on the graph; otherwise, it does not.
Example: For the equation x + y = 5, test points (3, 2), (4, 1), (0, 0), and (−1, 3).
Graphing Two-Variable Equations by Plotting Points
To graph an equation, calculate and plot several ordered pairs that satisfy the equation.
Isolate y (if possible): y = ...
Choose 3–5 x-values and compute corresponding y-values.
Plot the (x, y) points.
Connect the points with a line or curve.
Example: Graph y = √(x + 1) by choosing positive x-values only.
Graphing Intercepts
Intercepts are points where the graph crosses the axes.
x-intercept: Set y = 0 and solve for x.
y-intercept: Set x = 0 and solve for y.
Intercepts are written as ordered pairs.
Example: Find the x- and y-intercepts of a given graph.
Slopes of Lines
The slope (m) of a line measures its steepness and is calculated as the change in y divided by the change in x between two points (x₁, y₁) and (x₂, y₂):
Positive slope: line rises left to right.
Negative slope: line falls left to right.
Zero slope: horizontal line.
Undefined slope: vertical line.
Example: Find the slope between (−1, 1) and (4, 3).
Types of Slope
Positive: Upward from left to right.
Negative: Downward from left to right.
Zero: Horizontal line (y = constant).
Undefined: Vertical line (x = constant).
Forms of Linear Equations
Slope-Intercept Form:
Point-Slope Form:
Standard Form:
Use the appropriate form based on the information given (slope and intercept, a point and slope, or two points).
Parallel and Perpendicular Lines
Parallel lines: Same slope, different y-intercepts.
Perpendicular lines: Slopes are negative reciprocals.
Relations and Functions
A relation is any set of ordered pairs (x, y). A function is a relation where each input (x) has at most one output (y).
Vertical Line Test: If any vertical line crosses the graph more than once, it is not a function.
Example: {(−3, 5), (0, 2), (3, 5)} is a function; {(2, 5), (0, 2), (2, 9)} is not.
Function Notation and Evaluation
Functions are often written as instead of y. To evaluate, substitute the value for x.
Example: If , then .
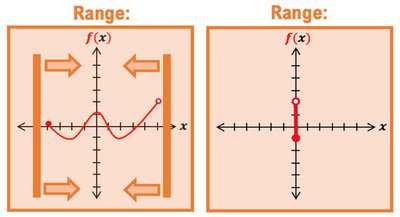
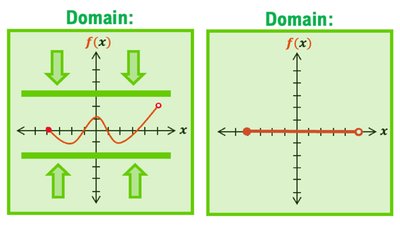
Domain and Range
The domain is the set of all possible x-values (inputs), and the range is the set of all possible y-values (outputs) for a function.
To find the domain, project the graph onto the x-axis.
To find the range, project the graph onto the y-axis.
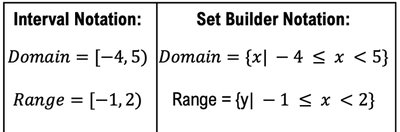
Use interval notation or set builder notation to express domain and range.
Finding the Domain of an Equation
For square roots: The expression inside must be non-negative.
For denominators: The denominator cannot be zero.
Example: For , domain is all real numbers except .
Example: For , domain is .
Graphs of Common Functions
Constant Function:
Identity Function:
Square Function:
Cube Function:
Square Root Function:
Cube Root Function:
Transformations of Functions
Transformations change the position or shape of a function's graph. The main types are:
Reflection | Shift | Stretch |
|---|---|---|
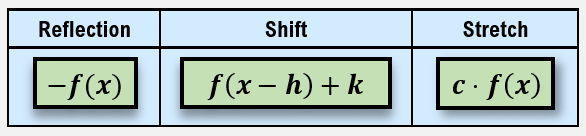
Reflection: Flips the graph over the x- or y-axis.
Shift: Moves the graph horizontally (h) or vertically (k).
Stretch/Shrink: Multiplies the function by a constant c, stretching or compressing the graph.
Example: shifts right by 3 and up by 2.
Function Operations
Addition/Subtraction:
Multiplication:
Division: ,
The domain of the result is the intersection of the domains of the original functions (and for division, where ).
Function Composition
Function composition involves substituting one function into another: .
To find the domain, exclude x-values not in the domain of g or that make not in the domain of f.
Example: If and , then .
Decomposing Functions
Decomposition is expressing a function as a composition of two or more simpler functions. For example, can be written as where and .
Additional info: These notes cover the foundational concepts of functions and graphs, including coordinate systems, graphing, intercepts, slopes, forms of linear equations, function types, domain and range, transformations, and function operations. Mastery of these topics is essential for success in precalculus and calculus.
