 Back
Precalculus Study Notes: Relations, Functions, and Linear Equations
Study Guide - Smart Notes
 Tailored notes based on your materials, expanded with key definitions, examples, and context.
Introduction to Relations and Functions
Definitions and Set Notation
Understanding relations and functions is foundational in precalculus. The language of set notation and interval notation is used to describe domains and ranges of functions.
Relation: A set of ordered pairs.
Domain: The set of all possible input values (x-values).
Range: The set of all possible output values (y-values).
Function: A relation in which each element in the domain corresponds to exactly one element in the range.
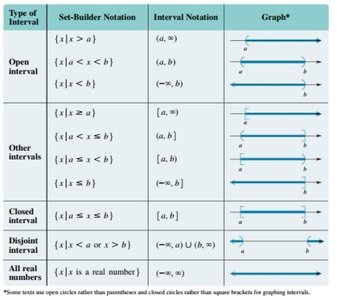
Intervals are often described using set-builder notation, interval notation, and visualized on a number line.
Example: For F = {(-5, 6), (3, 7), (-5, 10)}, the domain is {-5, 3} and the range is {6, 7, 10}. F is not a function because -5 is paired with two different y-values.
Vertical Line Test
The vertical line test is a graphical method to determine if a relation is a function. If any vertical line intersects the graph more than once, the relation is not a function.
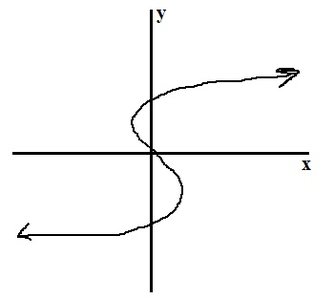
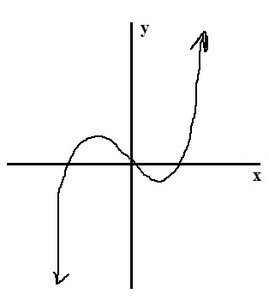
Key Point: Only graphs that pass the vertical line test represent functions.
Linear Functions and Equations
Forms of Linear Equations
Linear functions are described by equations of the form , where and are real numbers. There are several standard forms:
Standard Form:
Slope-Intercept Form:
Point-Slope Form:
To find intercepts:
x-intercept: Set and solve for .
y-intercept: Set and solve for .
Zero of a Function: A value such that ; corresponds to the x-intercept.
Slope of a Line
The slope of a line through points and is given by:
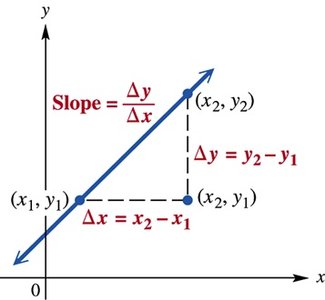
Example: Given a table of values, calculate the slope and write the equation in point-slope form.
Average Rate of Change
The average rate of change of a function on is:
This measures how much changes per unit change in .
Piecewise-Defined Functions
Definition and Graphical Representation
A piecewise function is defined by different expressions over different intervals of its domain. Each piece applies to a specific part of the domain.
Example:
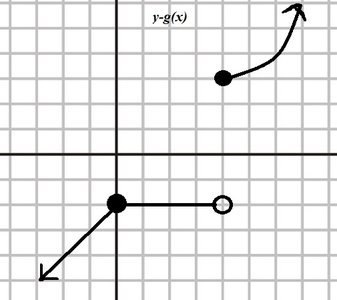
To evaluate a piecewise function, determine which interval the input belongs to and use the corresponding formula.
Graphs of Basic Functions
Parent Functions
Several basic functions serve as building blocks for more complex functions. Their graphs and properties are essential knowledge.
Constant Function:
Identity Function:
Squaring Function:
Cubing Function:
Square Root Function:
Cube Root Function:
Absolute Value Function:
Key Points: Each parent function has a characteristic shape, domain, and range.
Even and Odd Functions
Definitions and Symmetry
Even Function: for all in the domain. The graph is symmetric with respect to the y-axis. Odd Function: for all in the domain. The graph is symmetric with respect to the origin.
Example: is even; is odd.
Transformations of Functions
Vertical and Horizontal Shifts
Transformations move or change the shape of a graph:
Vertical Shift: shifts up by units; shifts down by $c$ units.
Horizontal Shift: shifts right by units; shifts left by $c$ units.
Example: is the absolute value function shifted right 3 units and up 1 unit.
Vertical Stretching, Shrinking, and Reflection
Vertical Stretch: , , stretches the graph vertically. Vertical Shrink: , compresses the graph vertically. Reflection: reflects across the x-axis; reflects across the y-axis.
Operations and Composition of Functions
Operations
Given functions and :
Addition:
Subtraction:
Multiplication:
Division: ,
Composition
The composition means to apply first, then to the result.
Quadratic Functions and Their Graphs
Standard and Vertex Form
A quadratic function is , . The vertex form is .
Vertex: , where and
Axis of Symmetry:
Opens Up: ; Opens Down:
Example: For , the vertex is at , .
End Behavior of Polynomial Functions
Leading Term and Degree
The end behavior of a polynomial function is determined by its leading term :
If is even and , both ends rise.
If is even and , both ends fall.
If is odd and , left end falls, right end rises.
If is odd and , left end rises, right end falls.
Example: has left end down, right end up.
Summary Table: Interval Notation
Types of Intervals
Intervals are used to describe sets of numbers, especially domains and ranges. The table below summarizes the main types:
Key: Parentheses ( ) indicate endpoints are not included; brackets [ ] indicate endpoints are included.
