 Back
Precalculus Worksheet Guidance: Analyzing Functions, Graphs, and Transformations
Study Guide - Smart Notes
 Tailored notes based on your materials, expanded with key definitions, examples, and context.
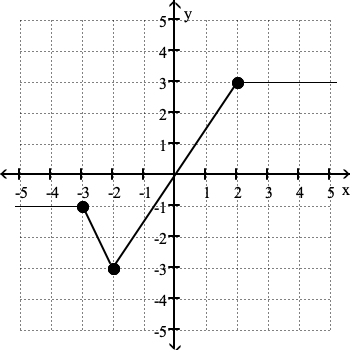
Q13. Use the graph of the function to find the following: a. the domain and range of the function; b. the intercepts, if any; c. the intervals on which the function is increasing, decreasing, or is constant; d. whether the function is even, odd, or neither.
Background
Topic: Graph Analysis and Function Properties
This question tests your ability to interpret a function's graph and determine its domain, range, intercepts, intervals of increase/decrease/constancy, and symmetry (even/odd/neither).
Key Terms and Formulas:
Domain: The set of all possible input values () for the function.
Range: The set of all possible output values () for the function.
Intercepts: Points where the graph crosses the axes (x-intercept and y-intercept).
Increasing/Decreasing/Constant Intervals: Where the function's output rises, falls, or stays the same as increases.
Even/Odd/Neither: Even functions satisfy ; odd functions satisfy ; neither if neither property holds.
Step-by-Step Guidance
Examine the graph to determine the domain. Look for the leftmost and rightmost points on the -axis where the function exists.
Identify the range by finding the lowest and highest -values the function attains.
Locate the intercepts: Find where the graph crosses the -axis (x-intercept) and the -axis (y-intercept).
Analyze the graph to see where the function is increasing, decreasing, or constant. Break the graph into intervals based on changes in direction.
Check for symmetry: Compare and visually to determine if the function is even, odd, or neither.
Try solving on your own before revealing the answer!
Final Answer:
a. Domain: ; Range:
b. Intercepts: x-intercept at ; y-intercept at
c. Intervals: Constant on ; decreasing on ; increasing on ; constant on
d. Symmetry: Neither even nor odd
The domain and range are determined by the extent of the graph horizontally and vertically. Intervals of increase/decrease/constancy are found by observing the slope of each segment. Symmetry is checked by comparing the graph to its reflection about the axes.
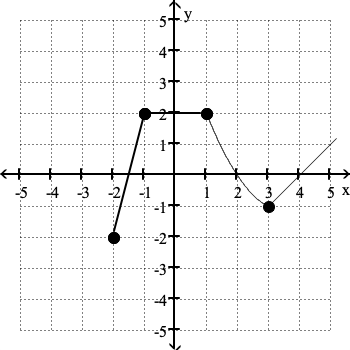
Q14. Use the graph of the function to find the following: a. the domain and range of the function; b. the intercepts, if any; c. the intervals on which the function is increasing, decreasing, or is constant; d. whether the function is even, odd, or neither.
Background
Topic: Graph Analysis and Function Properties
This question is similar to Q13, requiring you to analyze a different graph for domain, range, intercepts, intervals, and symmetry.
Key Terms and Formulas:
Domain: All values for which the function is defined.
Range: All values the function attains.
Intercepts: Where the graph crosses the axes.
Intervals of Increase/Decrease/Constancy: Where the function rises, falls, or stays constant.
Even/Odd/Neither: Symmetry properties as defined above.
Step-by-Step Guidance
Look at the graph to determine the domain. Identify the leftmost and rightmost -values where the function exists.
Find the range by observing the lowest and highest -values on the graph.
Identify the x-intercepts and y-intercept by locating where the graph crosses the axes.
Break the graph into intervals and determine where the function is increasing, constant, or decreasing.
Check for symmetry by comparing the graph to its reflection about the -axis and the origin.
Try solving on your own before revealing the answer!
Final Answer:
a. Domain: ; Range:
b. Intercepts: x-intercepts at ; y-intercept at
c. Intervals: Increasing on ; constant on ; decreasing on ; increasing on
d. Symmetry: Neither even nor odd
The domain and range are determined by the horizontal and vertical extent of the graph. Intervals are found by observing the direction of the graph in each segment. Symmetry is checked visually.
