 Back
BackProperties of Functions: Even/Odd Functions, Intervals, and Extrema
Study Guide - Smart Notes
 Tailored notes based on your materials, expanded with key definitions, examples, and context.
Section 2.3: Properties of Functions
Objective 1: Identify Even and Odd Functions from a Graph
Understanding whether a function is even, odd, or neither is fundamental in precalculus. These properties are determined by the symmetry of the function's graph.
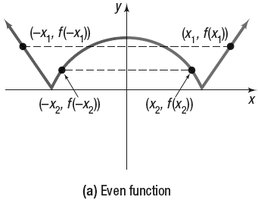
Even Function: A function f is even if, for every number x in its domain, f(-x) = f(x). The graph of an even function is symmetric with respect to the y-axis.
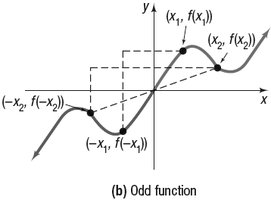
Odd Function: A function f is odd if, for every number x in its domain, f(-x) = -f(x). The graph of an odd function is symmetric with respect to the origin.
Theorem:
A function is even if and only if its graph is symmetric with respect to the y-axis.
A function is odd if and only if its graph is symmetric with respect to the origin.
Objective 2: Identify Even and Odd Functions from an Equation
To determine algebraically if a function is even, odd, or neither, substitute -x for x in the function and compare the result to the original function:
If f(-x) = f(x) for all x in the domain, the function is even.
If f(-x) = -f(x) for all x in the domain, the function is odd.
If neither condition holds, the function is neither even nor odd.
Example: For f(x) = x^2, f(-x) = (-x)^2 = x^2 = f(x), so the function is even.
Example: For f(x) = x^3, f(-x) = (-x)^3 = -x^3 = -f(x), so the function is odd.
Objective 3: Use a Graph to Determine Where a Function Is Increasing, Decreasing, or Constant
The behavior of a function can be described in terms of intervals where it is increasing, decreasing, or constant. This is determined by examining the graph of the function.
Increasing: A function f is increasing on an interval I if, for any x_1 < x_2 in I, f(x_1) < f(x_2).
Decreasing: A function f is decreasing on an interval I if, for any x_1 < x_2 in I, f(x_1) > f(x_2).
Constant: A function f is constant on an interval I if, for all x in I, f(x) is the same value.
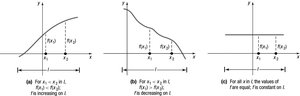
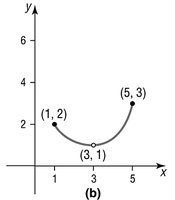
Example: The function in the graph below is increasing on some intervals, decreasing on others, and constant on others.
Objective 4: Use a Graph to Locate Local Maxima and Local Minima
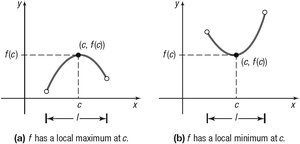
Local maxima and minima (also called local extrema) are points where a function reaches a highest or lowest value within a certain interval.
Local Maximum: f has a local maximum at c if f(c) ≥ f(x) for all x near c.
Local Minimum: f has a local minimum at c if f(c) ≤ f(x) for all x near c.
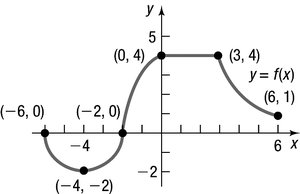
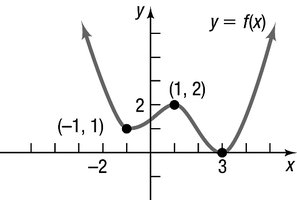
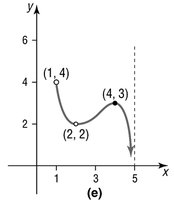
Example: In the graph below, identify the x-values where the function has local maxima and minima, and state the corresponding y-values.
Objective 5: Use a Graph to Locate Absolute Maximum and Absolute Minimum
The absolute maximum and minimum (also called global extrema) are the highest and lowest values a function attains on its domain or a specified interval.
Absolute Maximum: f has an absolute maximum at u if f(u) ≥ f(x) for all x in the interval.
Absolute Minimum: f has an absolute minimum at v if f(v) ≤ f(x) for all x in the interval.
Theorem (Extreme Value Theorem): If a function f is continuous on a closed interval [a, b], then f has both an absolute maximum and an absolute minimum on [a, b].
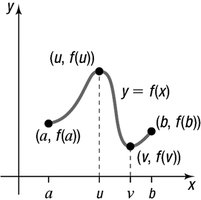
Example: For the graph below, find the absolute maximum and minimum values, and identify any local extrema.
Objective 6: Use a Graphing Utility to Approximate Local Maxima and Minima and to Determine Where a Function Is Increasing or Decreasing
Graphing utilities can be used to approximate the locations of local maxima and minima, as well as intervals of increase and decrease, especially when exact values are difficult to compute algebraically.
Example: Use a graphing calculator or software to graph a function and estimate the x-values where local extrema occur.
Objective 7: Find the Average Rate of Change of a Function
The average rate of change of a function between two points is the slope of the secant line connecting those points. This concept is foundational for understanding calculus.
Definition: For a function f and points a and b in its domain, the average rate of change from a to b is:
The numerator f(b) - f(a) is the "change in y" and the denominator b - a is the "change in x".
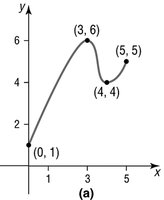
Example: For f(x) given in the graph, find the average rate of change from x = 1 to x = 3.
Theorem: The average rate of change of a function from a to b equals the slope of the secant line containing the points (a, f(a)) and (b, f(b)) on its graph.
