 Back
BackProperties of Functions: Even/Odd Functions, Intervals, Extrema, and Average Rate of Change
Study Guide - Smart Notes
 Tailored notes based on your materials, expanded with key definitions, examples, and context.
Section 1.3 Properties of Functions
Objectives Overview
Identify even and odd functions from a graph and from an equation.
Determine where a function is increasing, decreasing, or constant using a graph.
Locate local and absolute maxima and minima from a graph.
Use a graphing utility to approximate extrema and intervals of increase/decrease.
Find the average rate of change of a function.
Even and Odd Functions
Definition of Even Function
An even function is a function f such that for every number x in its domain, −x is also in the domain and:
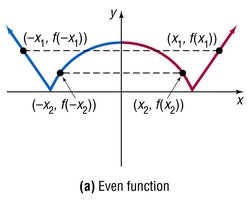
Key Property: The graph of an even function is symmetric with respect to the y-axis.
Definition of Odd Function
An odd function is a function f such that for every number x in its domain, −x is also in the domain and:
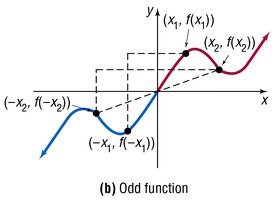
Key Property: The graph of an odd function is symmetric with respect to the origin.
Theorem: Symmetry and Function Type
A function is even if and only if its graph is symmetric with respect to the y-axis.
A function is odd if and only if its graph is symmetric with respect to the origin.
Examples: Determining Even and Odd Functions from Graphs
If a graph is symmetric about the y-axis, the function is even.
If a graph is symmetric about the origin, the function is odd.
If neither symmetry is present, the function is neither even nor odd.
Determining Even and Odd Functions Algebraically
To test if f is even, compute f(−x) and compare to f(x).
To test if f is odd, compute f(−x) and compare to −f(x).
If neither condition holds, the function is neither even nor odd.
Intervals of Increase, Decrease, and Constancy
Definitions
Increasing: A function f is increasing on an interval I if, for any choice of x_1 < x_2 in I, f(x_1) < f(x_2).
Decreasing: f is decreasing on I if, for any x_1 < x_2 in I, f(x_1) > f(x_2).
Constant: f is constant on I if, for all x in I, f(x) is the same value.
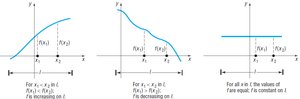
Example: Identifying Intervals from a Graph
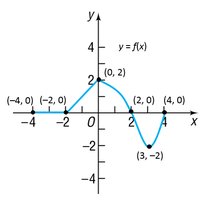
Given a graph, determine where the function is increasing, decreasing, or constant by observing the slope of the curve:
Increasing: The graph rises as you move left to right.
Decreasing: The graph falls as you move left to right.
Constant: The graph is flat (horizontal line).
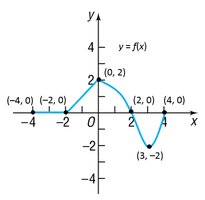
Local Maxima and Minima
Definitions
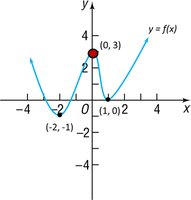
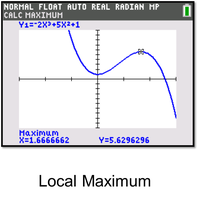
Local Maximum: f has a local maximum at c if there is an open interval containing c such that f(c) ≥ f(x) for all x in that interval.
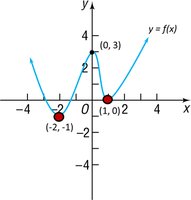
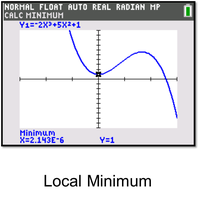
Local Minimum: f has a local minimum at c if there is an open interval containing c such that f(c) ≤ f(x) for all x in that interval.
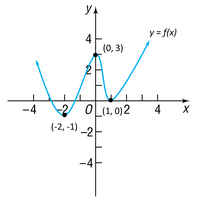
Example: Finding Local Extrema from a Graph
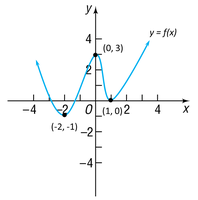
To find local maxima and minima, look for peaks (maximum) and valleys (minimum) in the graph.
Absolute Maximum and Minimum
Definitions
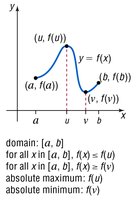
Absolute Maximum: f has an absolute maximum at u if f(u) ≥ f(x) for all x in the interval.
Absolute Minimum: f has an absolute minimum at v if f(v) ≤ f(x) for all x in the interval.
Example: Identifying Absolute Extrema from a Graph
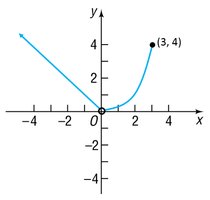
Check endpoints and any local extrema to determine the absolute maximum and minimum values.
Theorem: Extreme Value Theorem
If f is a continuous function on a closed interval [a, b], then f has both an absolute maximum and an absolute minimum on [a, b].
Using a Graphing Utility for Extrema and Intervals
Procedure
Graph the function using a graphing calculator or software.
Use built-in commands to approximate local maxima and minima.
Identify intervals of increase and decrease by observing the graph.
Average Rate of Change of a Function
Definition
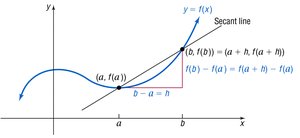
The average rate of change of a function f from a to b is:
Example: Calculating Average Rate of Change
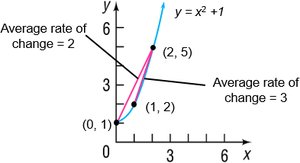
For f(x) = x^2 + 1:
From 0 to 2:
From 1 to 2:
Theorem: Slope of the Secant Line
The average rate of change of a function from a to b equals the slope of the secant line through the points (a, f(a)) and (b, f(b)) on its graph.
Example: Equation of a Secant Line
Given g(x) and two points (1, g(1)) and (3, g(3)):
Find the average rate of change (slope):
Use the point–slope form:
Convert to slope–intercept form if needed.
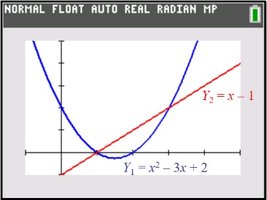
Additional info: These concepts are foundational for understanding calculus, where the average rate of change leads to the concept of the derivative, and local/absolute extrema are critical for optimization problems.
