 Back
Study Guide: Basics of Functions and Their Graphs (Precalculus)
Study Guide - Smart Notes
 Tailored notes based on your materials, expanded with key definitions, examples, and context.
Functions and Relations
Definitions and Properties
A relation is any set of ordered pairs. The domain of a relation is the set of all first components (inputs), and the range is the set of all second components (outputs). A function is a special type of relation where each element in the domain corresponds to exactly one element in the range.
Domain: All possible input values (x-values).
Range: All possible output values (y-values).
Function: Each input has only one output.
Example
Given the relation: (0, 187), (1, 212), (2, 225), (2, 238), the domain is {0, 1, 2} and the range is {187, 212, 225, 238}. Since the input 2 corresponds to two outputs (225 and 238), this relation is not a function.
Determining Functions from Graphs
The Vertical Line Test
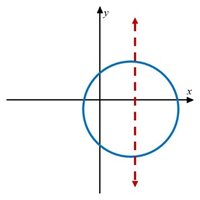
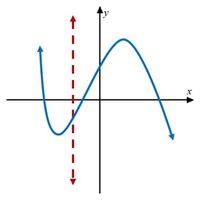
The Vertical Line Test is used to determine if a graph represents a function. If any vertical line intersects the graph at more than one point, the graph does not define y as a function of x.
If a vertical line crosses the graph more than once, it is not a function.
If every vertical line crosses the graph at most once, it is a function.
This graph fails the vertical line test and is not a function.
This graph passes the vertical line test and is a function.
Determining Functions from Equations
Solving for y
If an equation is solved for y and more than one value of y can be obtained for a given x, then the equation does not define y as a function of x.
Example: gives two values of y for most x, so it is not a function.
Function Notation
Understanding f(x)
Function notation uses f(x) to represent the value of the function at x. For example, if , then means substitute -5 for x.
is read as "f of x".
Represents the output for a given input x.
Graphing Functions
Visual Representation
The graph of a function is the set of its ordered pairs plotted in the coordinate plane. Comparing two functions visually helps understand their behavior.
Example: and are both linear functions.
The blue line represents and the red line represents . Both are straight lines, but is shifted downward by 3 units.
Analyzing Functions Using Graphs
Interpreting Values
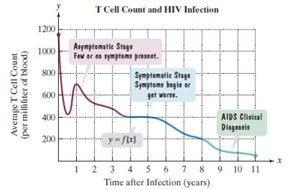
To find for a specific x, locate the x-value on the graph and read the corresponding y-value. To find x for a specific $f(x)$, locate the y-value and find the corresponding x-value(s).
This graph shows how the T cell count changes over time after HIV infection. The function models the relationship between time and T cell count.
Identifying Domain and Range from a Graph
Graphical Approach
To find the domain, look for all x-values where the graph exists. To find the range, look for all y-values the graph attains.
For this graph, the domain is and the range is .
Example
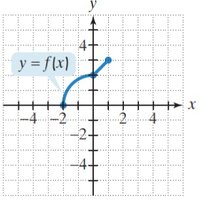
Domain: (open at -2, closed at 1)
Range: (closed at -1, open at 2)
f(1): Find the y-value when x = 1.
f(-2): Find the y-value when x = -2.
Intercepts of Functions
x- and y-Intercepts
The x-intercepts (or zeros) are points where the graph crosses the x-axis (). The y-intercept is the point where the graph crosses the y-axis (). A function can have multiple x-intercepts but only one y-intercept.
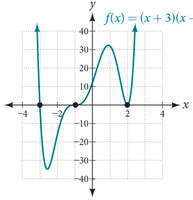
x-intercepts: Points where the graph crosses the x-axis.
y-intercept: Point where the graph crosses the y-axis.
Zeros: Values of x where .
Example Table: Intercepts and Domain/Range
Feature | Description |
|---|---|
x-intercepts | Where the graph crosses the x-axis |
y-intercept | Where the graph crosses the y-axis |
Domain | All x-values for which the function is defined |
Range | All y-values the function attains |
Summary Table: Function Properties
Property | How to Identify |
|---|---|
Function | Each input has one output; passes vertical line test |
Domain | All x-values with points on the graph |
Range | All y-values with points on the graph |
x-intercepts | Where graph crosses x-axis |
y-intercept | Where graph crosses y-axis |
Practice Questions
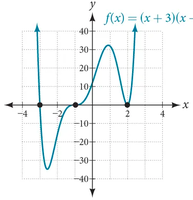
Is the graph a function?
Find the domain and range using interval notation.
For how many values of x is ?
Find one value of x such that .
Find .
What are the x-intercepts?
Find the y-intercept.
What are the zeros?
Additional info: These notes cover fundamental concepts from Precalculus Chapter 2: Functions and Graphs, including definitions, graphical analysis, and practice with domain, range, and intercepts.
