 Back
Study Guide: Graphical Behavior, Maxima/Minima, Average Rate of Change, and Polynomial Functions
Study Guide - Smart Notes
 Tailored notes based on your materials, expanded with key definitions, examples, and context.
Graphical Behavior of Functions
Increasing and Decreasing Functions
Understanding whether a function is increasing or decreasing is fundamental in precalculus. These concepts describe how the output values of a function change as the input values change.
Increasing Function: A function is increasing on an interval if, for any two values a and b in the interval with a < b, then . In Words: As inputs increase, outputs increase.
Decreasing Function: A function is decreasing on an interval if, for any two values a and b in the interval with a < b, then . In Words: As inputs increase, outputs decrease.

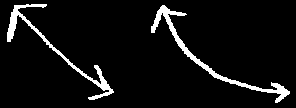
Intervals of Increase and Decrease
Intervals are often written in interval notation to specify where a function is increasing or decreasing.
Example: The function is increasing on and decreasing on .

Local and Absolute Extrema
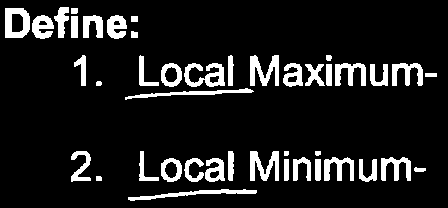
Local Maximum and Minimum
Local extrema are points where a function reaches a highest or lowest value within a certain neighborhood.
Local Maximum: A point where the y-value is greater than the immediately surrounding y-values.
Local Minimum: A point where the y-value is less than the immediately surrounding y-values.

Absolute Maximum and Minimum
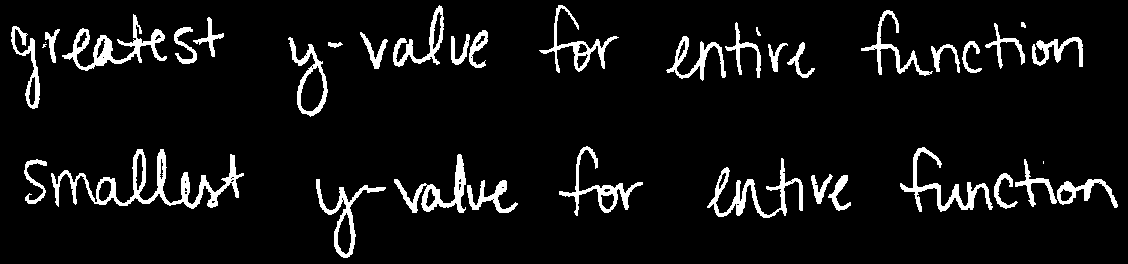
Absolute extrema are the greatest or smallest y-values for the entire function.
Absolute Maximum: The greatest y-value for the entire function.
Absolute Minimum: The smallest y-value for the entire function.
Finding Extrema from Graphs
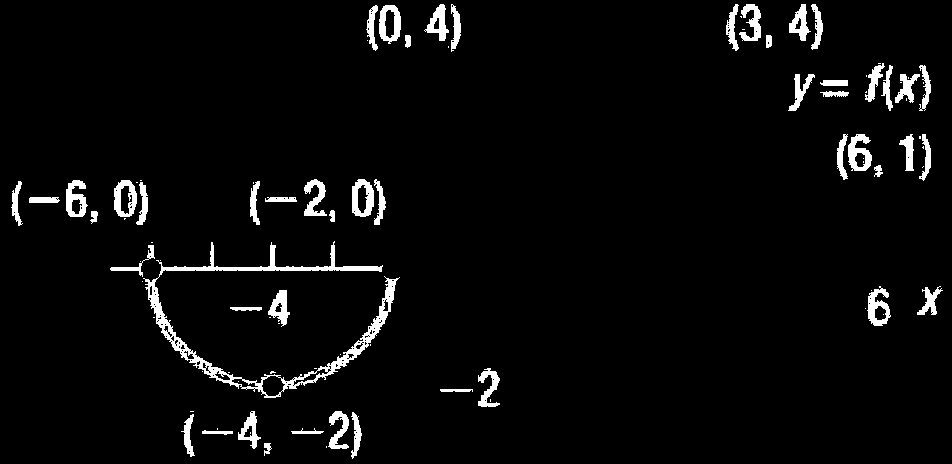
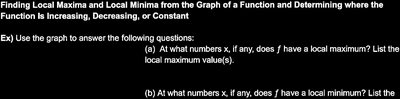
To find local and absolute maxima and minima, examine the graph for peaks (maxima) and valleys (minima).
Example: At , the maximum value is ... (context inferred: likely a y-value at x=1).
At or , there may be local minimum values.
Average Rate of Change
Definition and Formula
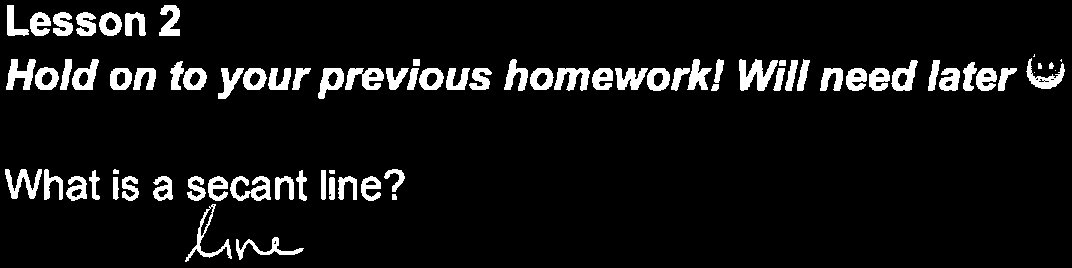
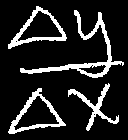
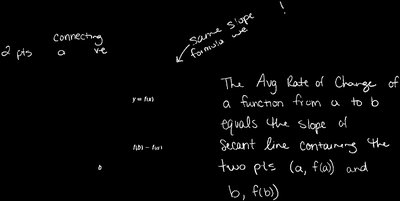
The average rate of change of a function between two points describes how the output changes per unit change in input. It is equivalent to the slope of the secant line connecting the two points.
Formula:
Notation:

Examples of Average Rate of Change
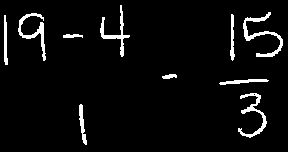
Example 1: For points (1, 3) and (3, 27):
Example 2: For points (5, 75) and (1, 3):
Secant Line
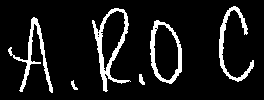
A secant line is a straight line connecting two points on the graph of a function. Its slope represents the average rate of change between those points.
Definition: The secant line through points and has slope .
Polynomial Functions and Their Degree
Identifying Polynomials
Polynomials are algebraic expressions consisting of terms with non-negative integer exponents.
Terms: Each part of a polynomial separated by plus or minus signs.
Coefficients: The numerical factors of each term.
Degree: The highest exponent of the variable in the polynomial.
Polynomial Functions
A polynomial function is a function that can be written in the form , where is a non-negative integer and are constants.
Example:
End Behavior of Polynomial Functions
The end behavior of a polynomial function describes how the function behaves as approaches positive or negative infinity. It is determined by the leading term (the term with the highest degree).
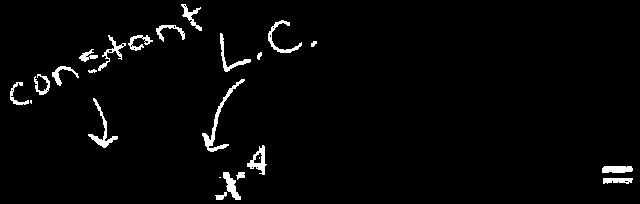
Constant: The function does not change as increases or decreases.
Leading Coefficient (L.C.): The coefficient of the highest degree term.

Summary Table: Graphical Behavior of Functions
The following table summarizes the graphical behavior of functions:
Behavior | Description |
|---|---|
Increasing | As input values increase, output values increase ( for ) |
Decreasing | As input values increase, output values decrease ( for ) |
Concave Up | The rate of change is increasing |
Concave Down | The rate of change is decreasing |

Practice and Assignments
Practice identifying intervals of increase/decrease, local/absolute extrema, and calculating average rate of change.
Assignment: pg 99 #87, 89. Quiz CED 2.1 to 2.3 upcoming.
Additional info:
Some context and examples were inferred for completeness, especially regarding the calculation of average rate of change and secant lines.
Graphs and interval notation were expanded for clarity.
