 Back
BackSystems of Inequalities in Two Variables
Study Guide - Smart Notes
 Tailored notes based on your materials, expanded with key definitions, examples, and context.
systems of Equations and Inequalities
Linear Inequalities in Two Variables and Their Solutions
Linear inequalities in two variables are expressions of the form Ax + By > C, Ax + By < C, Ax + By \geq C, or Ax + By \leq C.
The solution to such an inequality is any ordered pair (x, y) that, when substituted into the inequality, makes it a true statement.
Linear Equation: graphs as a straight line.
Linear Inequality: Changing '=' to '>', '<', '\geq', or '\leq' creates a region (half-plane) of solutions.
Solution: Any point (x, y) that satisfies the inequality.
Half-plane: The set of all points on one side of a line in the coordinate plane.
Graphing a Linear Inequality in Two Variables
To graph a linear inequality, follow these steps:
Replace the inequality symbol with '=' and graph the corresponding line.
Draw a solid line if the inequality is '\leq' or '\geq'; draw a dashed line if it is '<' or '>'.
Choose a test point (not on the line), substitute its coordinates into the inequality.
If the test point satisfies the inequality, shade the half-plane containing it; otherwise, shade the opposite half-plane.
Example: Graph .
Step 1: Graph (solid line through (2, 0) and (0, -4)).
Step 2: Test point (0, 0): (false).
Step 3: Shade the half-plane not containing (0, 0).
Graphing Linear Inequalities without Using Test Points
For vertical and horizontal lines, you can determine the shaded region directly:
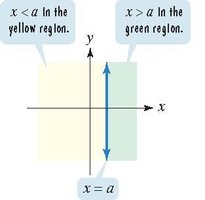
Vertical line :
If , shade to the right of the line.
If , shade to the left of the line.
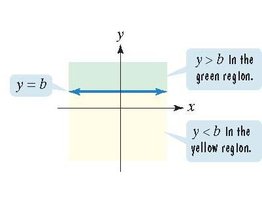
Horizontal line :
If , shade above the line.
If , shade below the line.
Example:
Graph : Draw a horizontal dashed line at , shade above.
Graph : Draw a solid vertical line at , shade to the left.
Graphing Nonlinear Inequalities in Two Variables
Nonlinear inequalities involve curves such as circles, parabolas, or ellipses. The process is similar to linear inequalities:
Graph the boundary curve (solid for '\leq' or '\geq', dashed for '<' or '>').
Choose a test point not on the curve and substitute into the inequality.
If the test point satisfies the inequality, shade the region containing it; otherwise, shade the opposite region.
Example: For a circle , shade the region inside the circle. For , shade the region outside the circle.
Graphing Systems of Linear Inequalities
A system of inequalities consists of two or more inequalities. The solution set is the region where all shaded areas overlap.
Graph each inequality on the same coordinate system.
The intersection of all shaded regions is the solution set.
Example: Graph the system:
Graph each line, shade the appropriate region for each, and the solution is the overlapping area.
Applications of Systems of Inequalities
Systems of inequalities are used in mathematical modeling, such as determining feasible regions in business, economics, and engineering problems. The solution set often represents all possible solutions that satisfy given constraints.
Step | Description |
|---|---|
1 | Graph each inequality individually. |
2 | Identify the region where all shaded areas overlap. |
3 | Check boundary lines for inclusion (solid or dashed). |
