Back
BackSystems of Linear Equations, Inequalities, and Functions: Precalculus Study Notes
Study Guide - Smart Notes
 Tailored notes based on your materials, expanded with key definitions, examples, and context.
Systems of Linear Equations and Inequalities
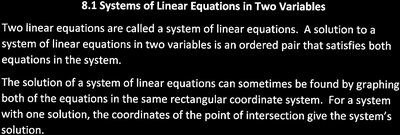
Systems of Linear Equations in Two Variables
Systems of linear equations consist of two or more linear equations with the same set of variables. A solution to a system in two variables is an ordered pair that satisfies both equations. The graphical solution is the intersection point of the lines represented by the equations.
System of Equations: Two or more equations considered together.
Solution: An ordered pair (x, y) that satisfies all equations in the system.
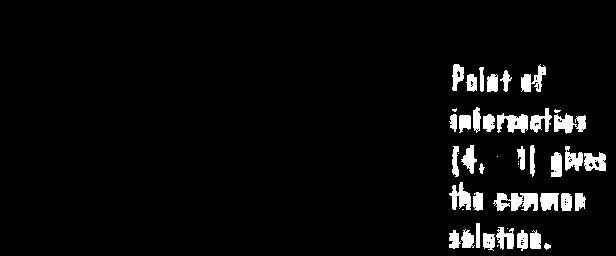
Graphical Solution: The intersection point of the lines on the coordinate plane.
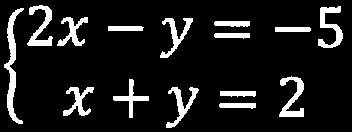
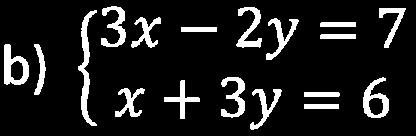
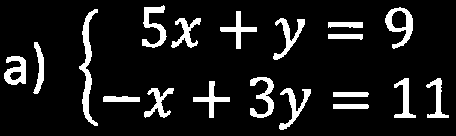
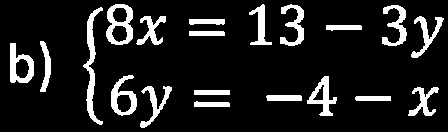
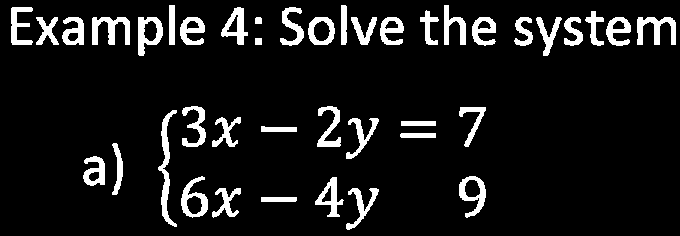
Example: Solve the system:
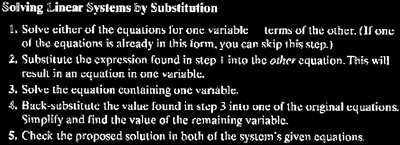
Solving Linear Systems by Substitution
The substitution method involves solving one equation for one variable and substituting this expression into the other equation. This reduces the system to a single equation in one variable.
Solve one equation for one variable in terms of the other.
Substitute this expression into the other equation.
Solve the resulting equation for one variable.
Back-substitute to find the other variable.
Check the solution in both original equations.
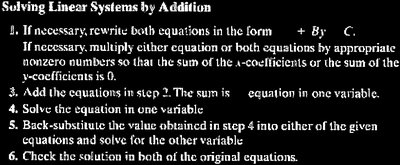
Solving Linear Systems by Addition (Elimination)
The addition (elimination) method involves adding or subtracting equations to eliminate one variable, making it possible to solve for the other variable.
If necessary, rewrite both equations in the form .
Multiply one or both equations by suitable numbers so that the coefficients of one variable are opposites.
Add the equations to eliminate one variable.
Solve for the remaining variable.
Back-substitute to find the other variable.
Check the solution in both original equations.
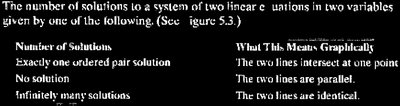
Number of Solutions to a System
The number of solutions to a system of two linear equations can be classified as follows:
Number of Solutions | What This Means Graphically |
|---|---|
Exactly one ordered pair solution | The two lines intersect at one point |
No solution | The two lines are parallel |
Infinitely many solutions | The two lines are identical |

Consistent and Dependent Systems
A system with at least one solution is called consistent. If the system has infinitely many solutions, it is called dependent. If the system has no solution, it is called inconsistent.
Consistent System: At least one solution (lines intersect or coincide).
Dependent System: Infinitely many solutions (lines coincide).
Inconsistent System: No solution (lines are parallel).
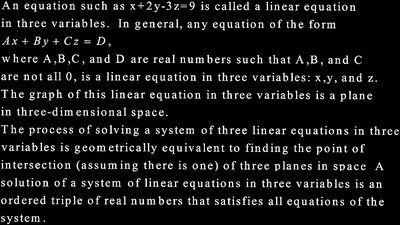
Systems of Linear Equations in Three Variables
A linear equation in three variables, such as , represents a plane in three-dimensional space. A solution is an ordered triple (x, y, z) that satisfies all equations in the system.
General Form:
Solution: The intersection point of three planes, if it exists.
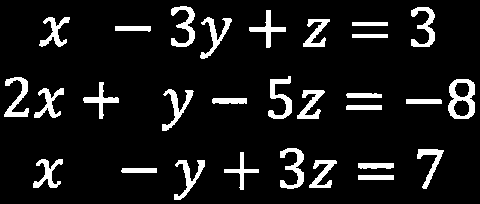
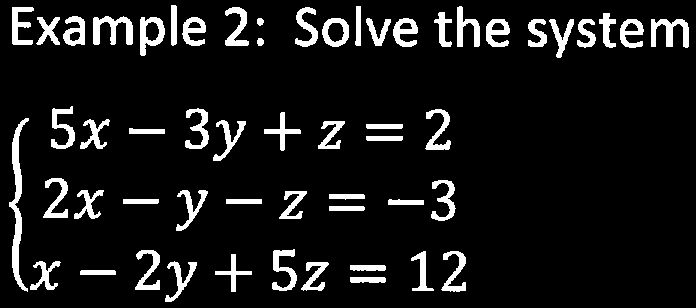
Solving Linear Systems in Three Variables by Eliminating Variables
To solve a system in three variables, reduce it to two equations in two variables by eliminating one variable, then solve the resulting system.
Reduce the system to two equations in two variables by elimination.
Solve the resulting system using addition or substitution.
Back-substitute to find the third variable.
Check the solution in all original equations.
Determinants and Matrices
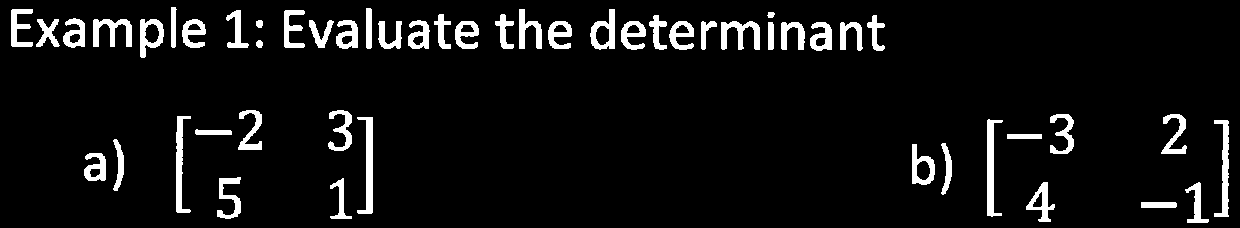
Definition of the Determinant of a 2x2 Matrix
The determinant of a 2x2 matrix is a special number calculated from its elements. For matrix , the determinant is .
Notation:
Formula:

Linear Equations and Rational Equations
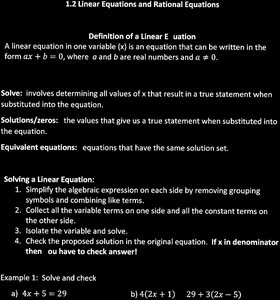
Definition of a Linear Equation
A linear equation in one variable is an equation that can be written in the form , where and are real numbers and .
Solution: The value(s) of that make the equation true.
Equivalent Equations: Equations with the same solution set.
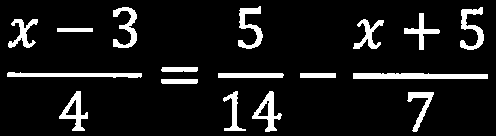
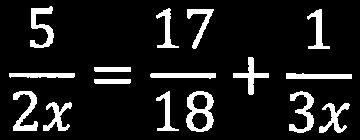
Solving Rational Equations
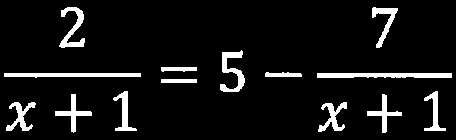
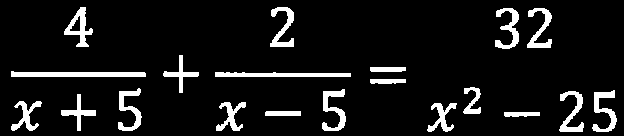
Rational equations involve fractions with variables in the denominator. To solve, clear denominators by multiplying both sides by the least common denominator (LCD), then solve the resulting equation.
Example:
Example:
Interval Notation and Inequalities
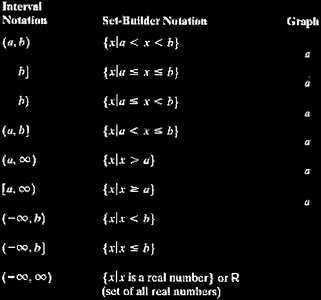
Interval and Set-Builder Notation
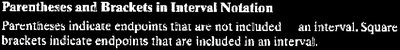
Intervals can be expressed using interval notation or set-builder notation. Parentheses indicate endpoints not included; brackets indicate endpoints included.
Interval Notation | Set-Builder Notation | Graph |
|---|---|---|
(a, b) | {x | a < x < b} | Open interval |
[a, b] | {x | a ≤ x ≤ b} | Closed interval |
[a, b) | {x | a ≤ x < b} | Left closed, right open |
(a, b] | {x | a < x ≤ b} | Left open, right closed |
(a, ∞) | {x | x > a} | Greater than a |
[a, ∞) | {x | x ≥ a} | Greater than or equal to a |
(-∞, b) | {x | x < b} | Less than b |
(-∞, b] | {x | x ≤ b} | Less than or equal to b |
(-∞, ∞) | {x | x is a real number} | All real numbers |
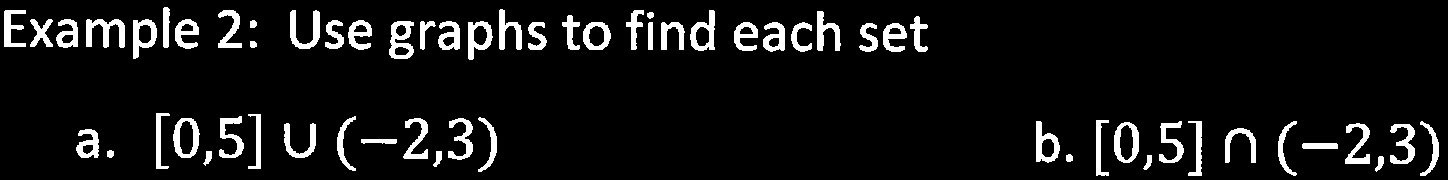
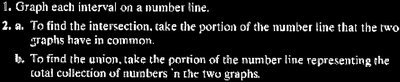
Graphing Intervals and Set Operations
Intervals can be graphed on a number line. The intersection (∩) is the overlap, and the union (∪) is the total collection of numbers in both intervals.

Solving and Graphing Linear Inequalities
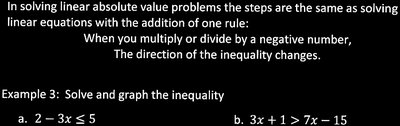
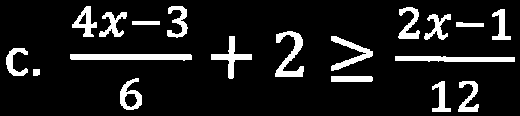
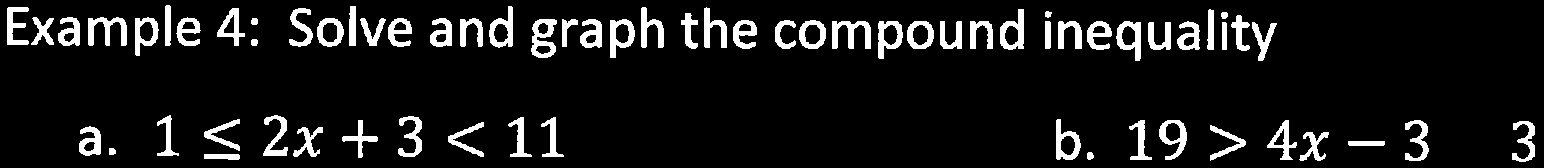
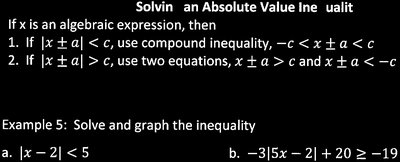
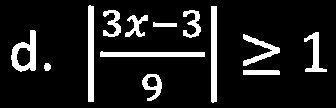
When solving inequalities, if you multiply or divide by a negative number, reverse the inequality sign. Compound inequalities and absolute value inequalities follow specific rules for solution and graphing.
Example:
Example:
Compound Inequality:
Absolute Value Inequality:

Functions and Their Graphs
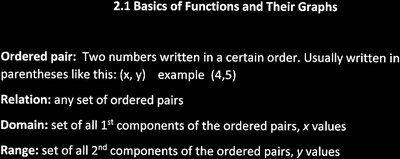
Basics of Functions and Their Graphs
A function is a relation in which each input (x-value) has exactly one output (y-value). The domain is the set of all possible x-values, and the range is the set of all possible y-values.
Ordered Pair: (x, y)
Relation: Any set of ordered pairs
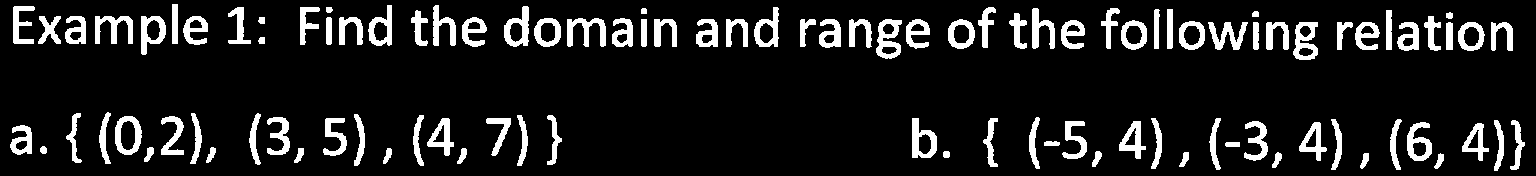
Domain: Set of all first components (x-values)
Range: Set of all second components (y-values)
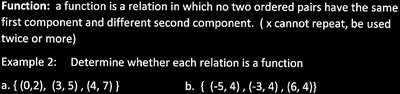
Definition of a Function
A function is a relation in which no two ordered pairs have the same first component with different second components. In other words, each input has only one output.
Test: If x repeats with different y-values, it is not a function.
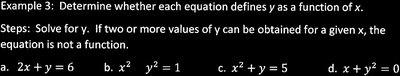
Determining Functions from Equations
To determine if an equation defines y as a function of x, solve for y. If any x-value gives more than one y-value, it is not a function.
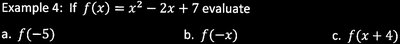
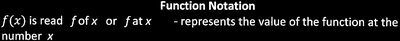
Function Notation
Function notation is read as "f of x" and represents the value of the function at x.
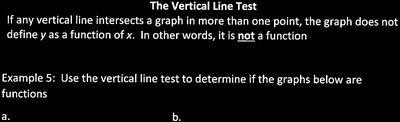
The Vertical Line Test
If any vertical line intersects a graph more than once, the graph does not represent y as a function of x. This is known as the vertical line test.
Test: If a vertical line crosses the graph at more than one point, it is not a function.