 Back
BackChapter 2: Research Methods in Psychology – Mini-Textbook Study Notes
Study Guide - Smart Notes
 Tailored notes based on your materials, expanded with key definitions, examples, and context.
Vital Safeguards Against Error in Psychological Research
Why Research Methods Matter
Scientific research methods are essential in psychology to reduce bias, error, and the influence of intuition or anecdotal evidence. Good research methods increase confidence in conclusions and help distinguish between valid findings and misleading claims.


Psychology as a Scientific Discipline
Core Features of Scientific Inquiry
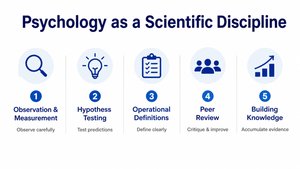
Psychology employs systematic observation, measurement, and hypothesis testing. Operational definitions, peer review, and the accumulation of evidence across studies are vital for building reliable knowledge.
Observation & Measurement: Careful and systematic data collection.
Hypothesis Testing: Formulating and testing predictions.
Operational Definitions: Clearly defining variables for measurement.
Peer Review: Scrutiny and critique by other experts.
Building Knowledge: Integrating findings across multiple studies.
Bias and Error in Research
Sources of Bias
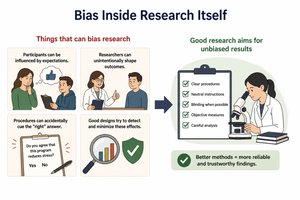
Bias can arise from participants' expectations, researchers' unintentional influence, or procedural cues. Good research designs aim to detect and minimize these effects to ensure trustworthy findings.
Participant Bias: Participants may alter behavior based on perceived expectations.
Researcher Bias: Subtle cues or expectations from researchers can shape outcomes.
Procedural Bias: Study procedures may inadvertently cue the 'right' answer.
Placebo Effect
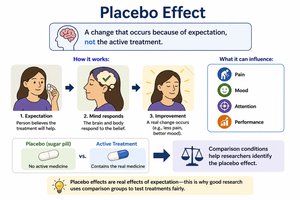
The placebo effect occurs when changes are due to participants' expectations rather than the active treatment. This effect can influence pain, mood, attention, and performance, highlighting the importance of comparison conditions in research.
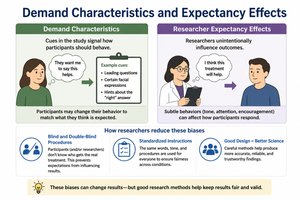
Demand Characteristics and Expectancy Effects
Demand characteristics are cues that signal how participants should behave, while researcher expectancy effects occur when researchers unintentionally influence outcomes. Blind and double-blind procedures, as well as standardized instructions, help reduce these biases.
Overview of Research Designs
Types of Research Designs
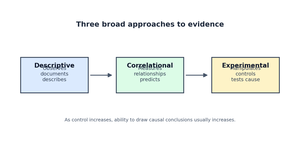
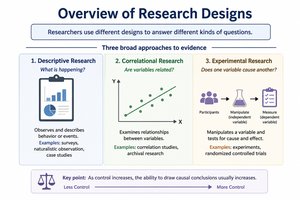
Psychological research uses three main designs: descriptive, correlational, and experimental. Each design answers different questions and has unique strengths and limitations.
Descriptive Research: Documents and describes behavior.
Correlational Research: Examines relationships between variables.
Experimental Research: Tests causal effects by manipulating variables.
Descriptive Research Methods
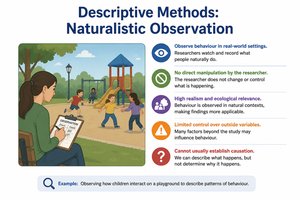
Naturalistic Observation
Researchers observe behavior in real-world settings without direct manipulation. This method offers high realism but limited control over variables and cannot establish causation.
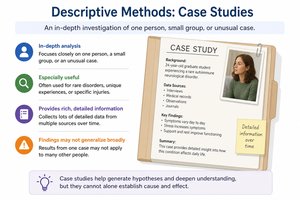
Case Studies
Case studies involve in-depth analysis of one person, a small group, or an unusual case. They provide rich detail, especially for rare conditions, but findings may not generalize broadly.
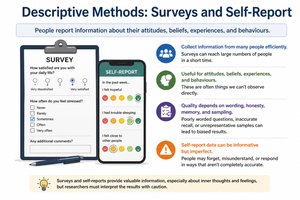
Surveys and Self-Report
Surveys collect information from many people efficiently, often about attitudes, beliefs, or behaviors. The quality of data depends on question wording, honesty, memory, and sampling.
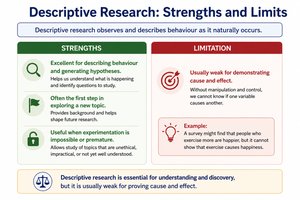
Strengths and Limits of Descriptive Research
Descriptive methods are excellent for describing behavior and generating hypotheses, especially when experimentation is not possible. However, they are usually weak for demonstrating cause and effect.
Correlational Research
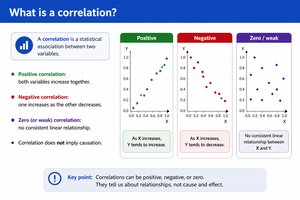
What is a Correlation?
A correlation is a statistical association between two variables. Correlations can be positive, negative, or zero, but do not imply causation.
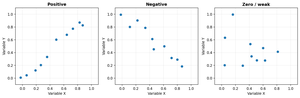
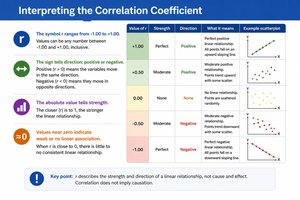
Interpreting the Correlation Coefficient
The correlation coefficient, symbolized as r, ranges from -1.00 to +1.00. The sign indicates direction (positive or negative), and the absolute value indicates strength. Values near zero suggest weak or no linear association.
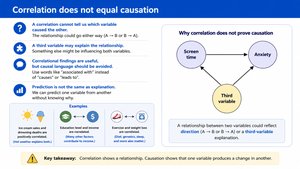
Correlation Does Not Equal Causation
Correlations reveal relationships but cannot determine which variable causes the other. A third variable may explain the association, and prediction is not the same as explanation.
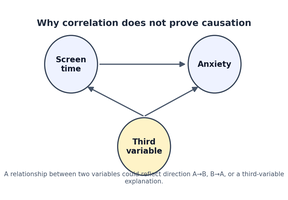
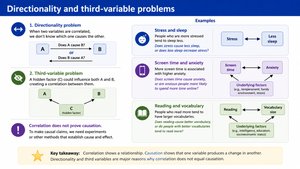
Directionality and Third-Variable Problems
The directionality problem asks whether A causes B or B causes A. The third-variable problem occurs when a hidden factor influences both variables. These issues limit causal conclusions from correlational data.
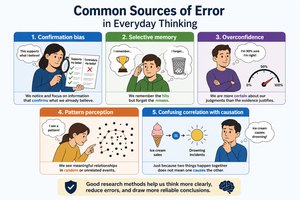
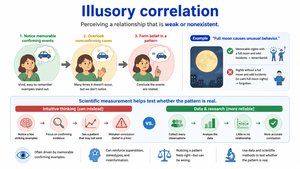
Illusory Correlation
Illusory correlation is the perception of a relationship that is weak or nonexistent, often driven by memorable examples. Scientific measurement helps test whether such patterns are real.
Experimental Research
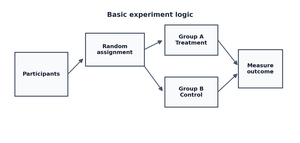
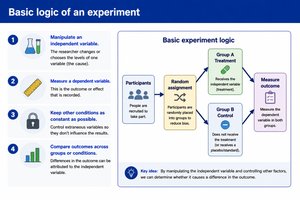
Basic Logic of an Experiment
Experiments manipulate an independent variable (IV), measure a dependent variable (DV), and keep other conditions constant to compare outcomes across groups. This design allows for causal conclusions.
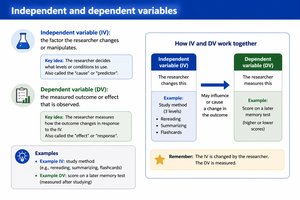
Independent and Dependent Variables
The independent variable is the factor changed by the researcher, while the dependent variable is the measured outcome. For example, the IV could be the study method, and the DV could be the test score.
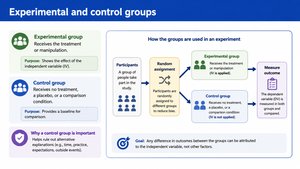
Experimental and Control Groups
The experimental group receives the treatment or manipulation, while the control group receives no treatment, a placebo, or a comparison condition. The control group helps rule out alternative explanations.
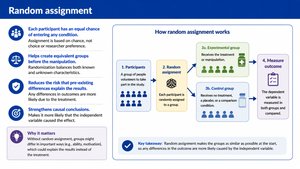
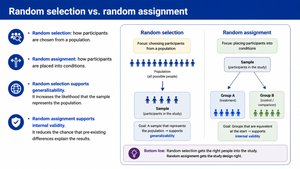
Random Assignment
Random assignment ensures each participant has an equal chance of being placed in any condition, creating equivalent groups and strengthening causal conclusions.
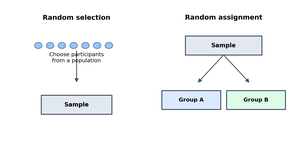
Random Selection vs. Random Assignment
Random selection refers to how participants are chosen from a population, supporting generalizability. Random assignment refers to how participants are placed into conditions, supporting internal validity.
Validity and Reliability in Research
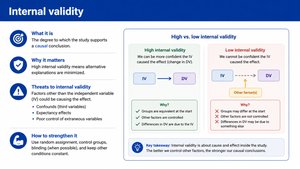
Internal Validity
Internal validity is the degree to which a study supports a causal conclusion. High internal validity means alternative explanations are minimized. Threats include confounds and expectancy effects.
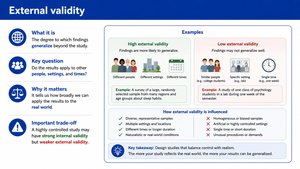
External Validity
External validity is the degree to which findings generalize beyond the study. Highly controlled studies may have strong internal validity but weaker external validity.
Reliability
Reliability refers to the consistency of a measure. A reliable measure yields stable results across time, items, or observers. Inconsistent measures weaken confidence in findings.
Validity
Validity refers to the accuracy or truthfulness of a measurement. A valid measure assesses what it claims to assess. A measure can be reliable without being valid.
Statistics in Psychological Research
Why Statistics Matter
Statistics help organize raw data, summarize patterns, and estimate whether results are likely due to chance. Statistical significance is not the same as practical importance.
Descriptive Statistics
Descriptive statistics include measures of central tendency (mean, median, mode) and measures of variability (range, standard deviation). These statistics describe data but do not explain it.
Central Tendency and Variability
Mean: Sensitive to extreme scores.
Median: More informative for skewed distributions.
Range: Spread from lowest to highest value.
Standard Deviation: Estimates spread around the mean.
Inferential Statistics
Inferential statistics estimate whether sample findings likely reflect population patterns and help evaluate whether observed results may be due to chance.
Statistical Significance and Practical Significance
Statistical Significance: The result is unlikely to be due to chance alone.
Practical Significance: The effect is large or meaningful in real life.
Key Takeaways
Research methods protect psychology from bias and error.
Descriptive methods describe behavior but rarely show causation.
Correlation reveals relationships but not cause and effect.
Experiments are strongest for causal testing.
Reliability, validity, and statistics determine how much we should trust the findings.
