What term describes the slope of a line representing a positive or negative correlation in a dataset?
The slope is described as positive for an upward trend and negative for a downward trend.
What is the most likely value of the correlation coefficient r for a dataset with a strong positive linear relationship?
The correlation coefficient r is most likely close to 1 for a strong positive linear relationship.
Which r-value represents the weakest correlation: -0.75, -0.27, 0.11, or 0.54?
0.11 represents the weakest correlation because it is closest to zero.
What does a graph with data points tightly clustered around an upward-sloping line indicate about the correlation coefficient?
It indicates that the correlation coefficient r is close to 1, showing a strong positive correlation.
Which r-value represents a moderate correlation: -0.92, -0.18, 0.56, or 0.83?
0.56 represents a moderate correlation because it is neither close to zero nor close to ±1.
What is the possible range of values for the correlation coefficient r?
The correlation coefficient r ranges from -1 to 1.
Which r-value is most likely for a dataset with a weak negative linear relationship: -0.65, -0.19, 0.19, or 0.75?
-0.19 is most likely for a weak negative linear relationship because it is negative and close to zero.
How can you identify a table that shows no correlation between two variables?
A table shows no correlation if the values of one variable do not consistently increase or decrease with the other variable.
How can you identify a table that shows a negative correlation between two variables?
A table shows negative correlation if, as one variable increases, the other variable tends to decrease.
What does a scatterplot with data points tightly clustered around a downward-sloping line indicate about the correlation coefficient?
It indicates that the correlation coefficient r is close to -1, showing a strong negative correlation.
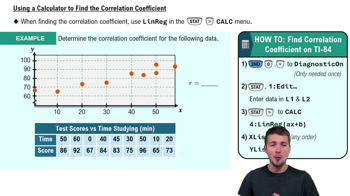
How do you determine the correlation coefficient r for a set of data?
You can determine r by entering the data into a graphing calculator and using the linear regression function to calculate r.
What does a scatterplot with data points widely scattered and no apparent trend indicate about the correlation coefficient?
It indicates that the correlation coefficient r is close to 0, showing no correlation.
What does a correlation coefficient of 1 indicate about the relationship between two variables?
A correlation coefficient of 1 indicates a perfect positive linear relationship.
Which r-value represents a moderate positive correlation: -0.57, -0.28, 0.28, or 0.57?
0.57 represents a moderate positive correlation.
What does a scatterplot with data points tightly clustered around an upward-sloping line indicate about the correlation coefficient?
It indicates that the correlation coefficient r is close to 1, showing a strong positive correlation.
How do you interpret the strength and direction of a correlation coefficient?
The sign of r indicates direction (positive for upward, negative for downward), and the magnitude indicates strength (closer to ±1 is stronger, closer to 0 is weaker).
Which r-value represents the weakest correlation among a set of values?
The r-value closest to zero represents the weakest correlation.
What does a scatterplot with data points loosely scattered around a downward-sloping line indicate about the correlation coefficient?
It indicates a weak negative correlation, with r being negative and closer to zero.
Which r-value represents a moderate correlation among a set of values?
An r-value around ±0.5 to ±0.7 typically represents a moderate correlation.
Which r-value represents the strongest negative correlation?
The r-value closest to -1 represents the strongest negative correlation.
How can you distinguish between a strong and a weak linear association in a scatterplot?
A strong association has data points tightly clustered around a line; a weak association has points more widely scattered.
Which r-value represents the weakest correlation: -0.75, -0.27, 0.11, or 0.54?
0.11 represents the weakest correlation.
What are the key properties of the linear correlation coefficient r?
r ranges from -1 to 1, measures strength and direction of linear relationship, and is unitless.
What does a correlation coefficient of -0.993 indicate about the relationship between two variables?
It indicates a very strong negative linear relationship.
How would you describe the correlation between weight and price of a product if the correlation coefficient is positive?
There is a positive association; as weight increases, price tends to increase.
What does a scatterplot with a strong downward trend indicate about the correlation coefficient?
It indicates a strong negative correlation, with r close to -1.
What type of analysis reveals association between data attributes?
Correlation analysis reveals association between data attributes.
What does correlation measure in statistics?
Correlation measures the strength and direction of a linear relationship between two variables.
How is correlation defined in statistics?
Correlation is a measure of the strength and direction of a linear relationship between two variables.
What is true about the correlation coefficient r?
r quantifies the strength and direction of a linear relationship and ranges from -1 to 1.
What does a graph with a downward-sloping line between x and y represent?
It represents a negative linear relationship between x and y.
What are the properties of the linear correlation coefficient?
It ranges from -1 to 1, is unitless, and measures strength and direction of linear association.
What does it mean for two variables to be positively associated?
As one variable increases, the other variable tends to increase as well.
What are the properties of the linear correlation coefficient?
r ranges from -1 to 1, is unitless, and measures strength and direction of linear relationship.
Does correlation imply causation?
Correlation does not imply causation; it only measures association.
What are the characteristics of the correlation coefficient?
It is a number between -1 and 1, measures strength and direction, and is unitless.
What did Galton use to calculate the strength of the relationship for the line of best fit?
Galton used the correlation coefficient to quantify the strength of the relationship.
Which r-value represents a moderate correlation: -0.92, -0.18, 0.56, or 0.83?
0.56 represents a moderate correlation.
Which is not a property of the linear correlation coefficient r?
 Back
Back

 05:43
05:43