Correlation measures the extent to which two factors vary together in a linear fashion.
How do you find the correlation coefficient for a set of data?
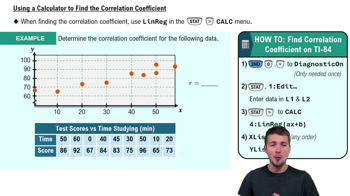
Enter the data into a calculator and use the linear regression function to calculate r.
The correlation coefficient measures only the strength of the _____ between variables.
Linear relationship.
What determines the sign (positive or negative) of a correlation coefficient?
Whether the variables increase together (positive) or one increases as the other decreases (negative).
What is the possible range for the correlation coefficient r?
r ranges from -1 to 1.
What two aspects of a relationship between variables does the correlation coefficient r measure?
The correlation coefficient r measures both the direction and the strength of the linear relationship between two variables. Direction is indicated by the sign, and strength by how close r is to ±1.
How can you visually distinguish between strong and weak correlation on a scatterplot?
Strong correlation is shown by data points tightly clustered around a straight line, while weak correlation has points more loosely scattered. The closer the points are to the line, the stronger the correlation.
What is the first step you should take on a TI-84 calculator before calculating the correlation coefficient?
You should turn on the 'diagnostic on' feature from the calculator's catalog before calculating the correlation coefficient. This ensures the calculator will display the r value in the output.
When using a calculator to find r, which lists are typically used for the x and y data?
The x data is usually entered into L1 and the y data into L2. These are the default lists used by the calculator's linear regression function.
Why should you not confuse the slope of the best fit line with the value of r?
The slope of the best fit line indicates the rate of change, while r measures how closely the data points cluster around that line. A line can have a steep or shallow slope regardless of the strength of the correlation.
When does the correlation coefficient indicate the weakest relationship between two variables?
The correlation coefficient indicates the weakest relationship when its value is closest to zero.
What can a correlation coefficient indicate about the relationship between two variables?
A correlation coefficient indicates both the direction (positive or negative) and the strength (strong or weak) of the linear relationship between two variables.
What value of the correlation coefficient represents the strongest correlation between two variables?
The strongest correlation is represented by a correlation coefficient (r) value closest to either +1 or -1.
Which correlation coefficient value indicates the strongest relationship between two variables?
A correlation coefficient value closest to +1 or -1 indicates the strongest relationship.
What does it mean if the correlation coefficient is negative?
If the correlation coefficient is negative, it means that as one variable increases, the other variable tends to decrease, indicating a downward trend.
In psychology, which correlation coefficient value indicates the strongest relationship between two variables?
In psychology, as in statistics generally, the strongest relationship is indicated by a correlation coefficient value closest to +1 or -1.
Which r-value represents the weakest correlation between two variables?
The r-value closest to zero represents the weakest correlation.
How can you identify the strongest correlation among several correlation coefficients?
The strongest correlation is identified by the r-value that is closest to +1 or -1.
Which r-value represents the weakest correlation in a dataset?
The r-value closest to zero represents the weakest correlation in a dataset.
What is considered the strongest correlation between two variables?
The strongest correlation is when the correlation coefficient (r) is closest to +1 or -1.
What is the strongest possible value for a correlation coefficient?
The strongest possible value for a correlation coefficient is +1 or -1.
What does a negative correlation coefficient mean in statistics?
A negative correlation coefficient means that as one variable increases, the other variable tends to decrease, showing a negative linear relationship.
What is the interpretation of a negative correlation coefficient?
A negative correlation coefficient indicates a downward trend, meaning that the variables move in opposite directions.
Which correlation coefficient value best represents a moderate relationship between two variables?
A correlation coefficient value around ±0.5 to ±0.7 typically represents a moderate relationship.
 Back
Back

 05:43
05:43