Skip to main content
Statistics
My Course
Learn
Exam Prep
AI Tutor
Study Guides
Textbook Solutions
Flashcards
Explore
Try the app
My Course
Learn
Exam Prep
AI Tutor
Study Guides
Textbook Solutions
Flashcards
Explore
Try the app
Back
Hypothesis Testing: Proportions - Excel definitions
You can tap to flip the card.
Null Hypothesis
You can tap to flip the card.
👆
Null Hypothesis
Represents the assumption that the population proportion equals a specified value, serving as the baseline for statistical testing.
Track progress
Control buttons has been changed to "navigation" mode.
1/15
Related flashcards
Related practice
Recommended videos
Hypothesis Testing: Proportions - Excel quiz
Hypothesis Testing: Proportions - Excel
15 Terms
9. Hypothesis Testing for One Sample
1 topic
3 problems
Chapter
David-Paige
08:19
Performing Hypothesis Tests: Proportions - Excel
188
views
3
rank
08:31
Performing Hypothesis Tests: Proportions - Excel Example 1
153
views
2
rank
10:24
Performing Hypothesis Tests: Proportions - Excel Example 2
136
views
3
rank
Terms in this set (15)
Hide definitions
Null Hypothesis
Represents the assumption that the population proportion equals a specified value, serving as the baseline for statistical testing.
Alternative Hypothesis
Expresses the claim being tested, indicating the population proportion differs from the value stated in the null hypothesis.
Population Proportion
Describes the fraction of individuals in the entire population exhibiting a particular characteristic.
Sample Proportion
Measures the fraction of individuals in the sample with a specific attribute, calculated as successes divided by sample size.
Alpha
Denotes the threshold probability for statistical significance, commonly set at 0.05 in hypothesis testing.
Test Statistic
Quantifies the difference between observed and expected sample results, standardized for comparison to a reference distribution.
Z Score
Indicates how many standard deviations the sample proportion is from the hypothesized population proportion.
P Value
Represents the probability of observing results as extreme as the sample, assuming the null hypothesis is true.
Sample Size
Refers to the number of individuals or observations included in the sample for analysis.
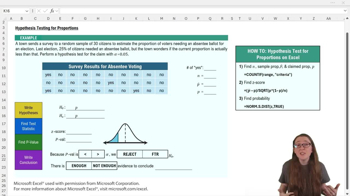
COUNTIF
Excel function used to tally occurrences of a specified response within a dataset, aiding in calculating sample proportions.
NORM.S.DIST
Excel function that computes cumulative probabilities for the standard normal distribution, useful for finding p values.
Left Tail Probability
Probability that a value falls below a specified threshold in a distribution, relevant for one-sided hypothesis tests.
Cumulative Probability
Total probability up to a certain value in a distribution, often used to determine p values in hypothesis testing.
Inferential Statistics
Branch of statistics focused on drawing conclusions about populations based on sample data.
Absentee Ballot
Voting method allowing individuals to participate in elections without being physically present at polling locations.
 BackBack
 08:19
08:19