What does it mean for a correlation to be statistically significant in the context of hypothesis testing for the population correlation coefficient?
A correlation is statistically significant if the p-value from the hypothesis test is less than the significance level (α), leading to rejection of the null hypothesis that the population correlation coefficient (ρ) is zero. This indicates there is enough evidence to conclude a linear relationship exists between the variables in the population.
How do you determine the critical value for the correlation coefficient when testing for statistical significance?
To find the critical value for the correlation coefficient, you first determine the significance level (α) and the sample size (n). Then, you use a statistical table or calculator to find the critical value of r based on α and n, or use the TI-84's linreg t-test function, which calculates the p-value for the observed r. If the absolute value of the sample correlation coefficient r exceeds the critical value, the correlation is considered statistically significant.
What is the null hypothesis when testing for the population correlation coefficient using the TI-84?
The null hypothesis is that the population correlation coefficient ρ equals zero, indicating no linear correlation. This means any observed correlation in the sample is due to random chance.
How do you decide which alternative hypothesis to use in a correlation hypothesis test?
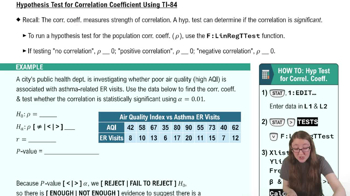
You choose the alternative hypothesis based on the research question, such as ρ ≠ 0 for any association, ρ > 0 for positive correlation, or ρ < 0 for negative correlation. The wording in the problem (e.g., 'associated' vs. 'positively associated') guides this choice.
What steps must you follow to enter data into the TI-84 for a correlation hypothesis test?
First, press the 'stat' button and select 'edit' to enter your x-values in L1 and y-values in L2. Ensure the data is correctly entered before proceeding to the hypothesis test.
Which menu option on the TI-84 do you use to perform a hypothesis test for correlation?
You use the 'LinRegTTest' function, which is option F under the 'tests' menu. This function calculates both the sample correlation coefficient and the p-value.
What information must you verify in the LinRegTTest setup menu before running the test?
You must ensure the correct lists are selected for x and y, the frequency is set to 1, and the appropriate alternative hypothesis is chosen. These settings ensure the test matches your data and research question.
What does a p-value much smaller than the significance level α indicate in a correlation test?
A p-value much smaller than α means you reject the null hypothesis. This provides strong evidence that a linear correlation exists in the population.
Does a statistically significant correlation test result tell you the exact value of the population correlation coefficient?
No, it only tells you that there is evidence for a nonzero linear correlation. It does not specify the actual value of ρ in the population.
What is the main limitation of the hypothesis test for the population correlation coefficient as described in the video?
The test only determines whether a linear correlation exists, not the strength or direction beyond what is specified in the alternative hypothesis. It also does not imply causation between the variables.
 Back
Back
 03:39
03:39