Skip to main content
Statistics
My Course
Learn
Exam Prep
AI Tutor
Study Guides
Textbook Solutions
Flashcards
Explore
Try the app
My Course
Learn
Exam Prep
AI Tutor
Study Guides
Textbook Solutions
Flashcards
Explore
Try the app
Back
Inferences for Slope definitions
You can tap to flip the card.
Regression Line
You can tap to flip the card.
👆
Regression Line
A straight line summarizing the relationship between two quantitative variables in a dataset.
Track progress
Control buttons has been changed to "navigation" mode.
1/15
Related flashcards
Related practice
Recommended videos
Inferences for Slope quiz
Inferences for Slope
15 Terms
Inferences for Slope
12. Regression
Topic
12. Regression
5 topics
6 problems
Chapter
02:31
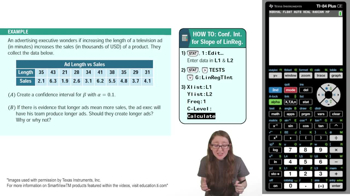
Confidence Interval for the Slope of a Regression Line Example 5
174
views
1
rank
02:47
Confidence Interval for the Slope of a Regression Line Example 4
182
views
1
rank
04:13
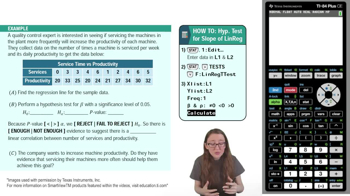
Hypothesis Test for the Slope of a Regression Line Example 3
210
views
2
rank
Terms in this set (15)
Hide definitions
Regression Line
A straight line summarizing the relationship between two quantitative variables in a dataset.
Slope
A value indicating the direction and strength of the linear relationship between two variables.
Population Regression Line
A theoretical line representing the true linear relationship between variables for an entire population.
Linear Correlation
A statistical association where changes in one variable predict proportional changes in another.
Null Hypothesis
An assumption stating there is no linear relationship between the studied variables, often represented by a zero slope.
Alternative Hypothesis
A claim suggesting a linear relationship exists, indicated by a nonzero slope in the regression line.
Alpha
A threshold probability, commonly set at 0.05, used to determine statistical significance in hypothesis testing.
P-value
A calculated probability measuring the strength of evidence against the null hypothesis in statistical tests.
Confidence Interval
A range of values estimated from data, within which the true slope is likely to fall with a specified probability.
LinRegTTest
A TI-84 calculator function used to perform hypothesis tests for the slope of a regression line.
LinRegTInt
A TI-84 calculator function used to compute confidence intervals for the slope of a regression line.
Beta
A parameter representing the slope of the population regression line, central to testing linear relationships.
Confidence Level
A percentage indicating how certain one is that the confidence interval contains the true slope.
Frequency
A setting in statistical software specifying how often each data point occurs, typically set to one for unique entries.
Test Menu
A section in the TI-84 calculator interface where statistical tests and interval calculations are selected.
 BackBack
 02:31
02:31