What type of risk does standard deviation measure in a dataset?
Standard deviation measures the risk associated with variability or volatility, specifically the risk of how much data values deviate from the mean (spread risk).
What does a high standard deviation indicate about the data in a dataset?
A high standard deviation indicates that the data values are widely spread out from the mean, showing greater variability within the dataset.
How is a high standard deviation interpreted in the context of data dispersion?
A high standard deviation means that the data points are dispersed over a wider range of values, rather than being closely clustered around the mean.
According to the empirical rule, what percentage of data falls within one standard deviation of the mean in a normal distribution?
Approximately 68% of the data falls within one standard deviation of the mean in a normal distribution.
What is the empirical rule and how does it relate to standard deviation?
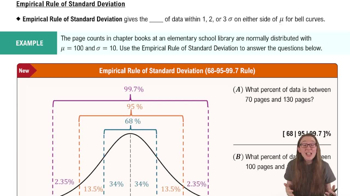
The empirical rule states that in a normal distribution, about 68% of data lies within one standard deviation of the mean, 95% within two, and 99.7% within three standard deviations.
What condition must be met before applying the empirical rule to a dataset?
The dataset must have a normal distribution, meaning it should be bell-shaped and symmetrical about the mean. This ensures the empirical rule's percentages are valid.
How is the interval for the empirical rule defined in terms of standard deviations from the mean?
The interval must be a whole number of standard deviations away from the mean, such as mean ± 1, 2, or 3 standard deviations. This allows the rule to estimate the percentage of data within those bounds.
What is the alternate name for the empirical rule based on its key percentages?
The empirical rule is also called the 68-95-99.7 rule. This name refers to the approximate percentages of data within one, two, and three standard deviations of the mean.
According to the range rule of thumb, when is a data value considered significantly high or low?
A value is considered significantly high if it is two or more standard deviations above the mean, and significantly low if it is two or more standard deviations below the mean. These values are rare and stand out from the rest of the data.
If a value lies within two standard deviations of the mean, how is it interpreted according to the range rule of thumb?
It is interpreted as not significant or not surprising, since most data values are expected to fall within this range. Only values outside this range are considered unusual or noteworthy.
 Back
Back

 05:42
05:42