Skip to main content
Statistics
My Course
Learn
Exam Prep
AI Tutor
Study Guides
Textbook Solutions
Flashcards
Explore
Try the app
My Course
Learn
Exam Prep
AI Tutor
Study Guides
Textbook Solutions
Flashcards
Explore
Try the app
Back
Prediction Intervals - Excel definitions
You can tap to flip the card.
Prediction Interval
You can tap to flip the card.
👆
Prediction Interval
A range for a predicted value in regression, reflecting uncertainty and calculated using margin of error, critical t-value, and standard error.
Track progress
Control buttons has been changed to "navigation" mode.
1/15
Related flashcards
Related practice
Recommended videos
Prediction Intervals - Excel quiz
Prediction Intervals - Excel
15 Terms
12. Regression
5 topics
6 problems
Chapter
08:20
Prediction Intervals - Excel
131
views
3
rank
Terms in this set (15)
Hide definitions
Prediction Interval
A range for a predicted value in regression, reflecting uncertainty and calculated using margin of error, critical t-value, and standard error.
Regression Line
A linear equation modeling the relationship between two variables, used to estimate y values from x values in a dataset.
Point Estimate
A single predicted value for y, obtained by substituting a specific x value into the regression equation.
Margin of Error
The amount added and subtracted from a point estimate to create an interval, incorporating variability and confidence level.
Critical t-value
A value from the t-distribution used to scale the margin of error, based on confidence level and degrees of freedom.
Standard Error of the Estimate
A measure of the typical distance between observed y values and the regression line, indicating prediction accuracy.
Linear Correlation
A statistical relationship where two variables change together in a straight-line pattern, often measured by R squared.
R Squared
A statistic indicating the proportion of variance in y explained by x, with values close to 1 showing strong linear association.
Degrees of Freedom
A value representing the number of independent data points minus two in regression, used in t-value calculations.
X Bar
The mean of all x values in a dataset, used in margin of error calculations for prediction intervals.
Sum of Squares
The total of each x value squared and added together, used in regression calculations for variability.
Confidence Interval
A range estimating a population parameter, similar to prediction intervals but for means or proportions.
Data Range
The span of x values collected in a dataset, within which predictions are considered valid.
Scatterplot
A graphical display of paired data points, showing the relationship and linearity between variables.
Excel Function
A built-in formula in Excel, such as T.INV.2T or SUMSQ, used to automate statistical calculations.
 BackBack
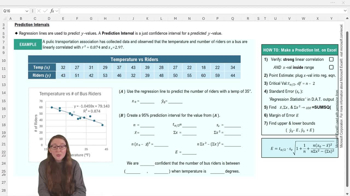
 08:20
08:20