 Back
Introductory Statistics: Displaying and Describing Categorical Data
 08:18

Terms in this set (17)
The data must be counts or percentages of individuals placed into categories when creating bar or pie charts.
The frequency distribution of a variable shown in the margins of a contingency table.
The relative percentages of the population belonging to combinations of categories from two variables (rows and columns).
Bar charts divided into segments representing subgroups, showing how a whole is divided across categories.
1. Make a picture to think critically about data.
2. Make a picture to clearly show trends.
3. Make a picture to effectively communicate data to others.
The area of a graph part must correspond to the magnitude of the value it represents to avoid misleading impressions.
They count the frequency of values in one category and help uncover relative proportions using relative frequency tables.
Bar charts show counts or relative frequencies clearly, making proportions easy to compare visually.
Pie charts show the whole group as a circle divided into parts, making it easy to estimate relative sizes quickly, but bar charts are more precise for percentages.
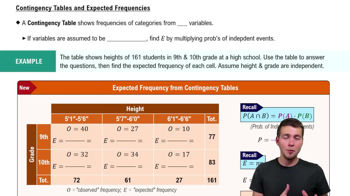
A table showing counts for two variables, useful for examining relationships between categories across rows and columns.
The distribution of one variable for a fixed category of another variable, used to understand dependence between variables.
If the conditional distributions of one variable are the same across categories of the other, variables are independent; otherwise, they are dependent.
A phenomenon where a trend appears in several groups but reverses when the groups are combined, showing the importance of considering lurking variables.
It shows survival rates by class, with counts and percentages for alive and dead passengers across First, Second, Third, and Crew classes.
By the total percentages of passengers in each class, shown in the margins of the contingency table.
They display the frequency or percentage of passengers in each class, making comparisons clear.
It shows the proportion of passengers in each class as slices of a circle, representing the whole population.