 Back
Introductory Statistics Key Concepts
 04:24


Terms in this set (20)
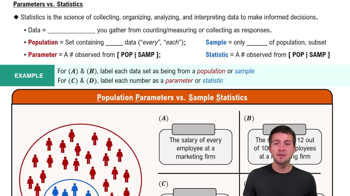
A population includes all members of a group being studied, while a sample is a subset of the population used to make inferences.
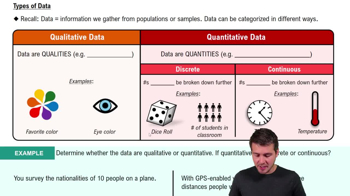
Quantitative data are numerical and measurable, while qualitative data are descriptive and categorical.
A blind study is one where participants do not know which treatment they receive to prevent bias.
A double blind study is one where neither participants nor experimenters know who receives the treatment, reducing bias further.
Nominal: categories without order; Interval: ordered with equal intervals but no true zero; Ratio: ordered with equal intervals and a true zero.
Data points far from the mean or outside typical ranges, often beyond 2 or 3 standard deviations, are considered unusual or very unusual.
Frequency is the number of times a data value or category occurs in a dataset.
The mean is the sum of all data values divided by the number of values: \(\bar{x} = \frac{\sum x_i}{n}\).
Standard deviation measures the average distance of data points from the mean, indicating data spread.
Population standard deviation: \(\sigma = \sqrt{\frac{\sum (x_i - \mu)^2}{N}}\).
Sample standard deviation: \(s = \sqrt{\frac{\sum (x_i - \bar{x})^2}{n-1}}\).
X minus MSSX refers to the deviation of a data point from the mean, i.e., \(x_i - \bar{x}\).
The empirical rule states that for normal distributions, about 68% of data lie within 1 standard deviation, 95% within 2, and 99.7% within 3.
Arrange data in order and subtract the smallest value from the largest to find the range.
The IQR is the difference between the third quartile (Q3) and first quartile (Q1), measuring the middle 50% spread.
Variance is the average of squared deviations from the mean, representing data spread.
Chebyshev's theorem states that for any distribution, at least 1 - 1/k² of data lies within k standard deviations of the mean, for k > 1.
Standard deviation is the square root of the variance.
Population variance divides by N; sample variance divides by n-1 to correct bias.
They visually display data distribution and frequency of values or categories.