 Back
Introductory Statistics Review
 08:45

Terms in this set (20)
The expected value is the long-run average or mean of a random variable's possible values weighted by their probabilities.
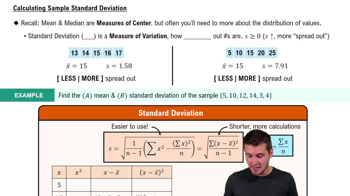
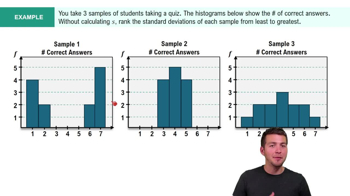
Standard deviation measures the average amount of variability or dispersion around the mean in a data set.
A Venn diagram visually represents sets and their relationships, such as intersections, unions, and complements in probability.
Conditional probability is the probability of an event given another event has occurred, while unconditional probability is the probability of an event without any conditions.
P(A ∪ B) = P(A) + P(B) - P(A ∩ B), where \(P(A \cup B) = P(A) + P(B) - P(A \cap B)\)
The sample space is the set of all possible outcomes of a random experiment.
Two events are independent if the occurrence of one does not affect the probability of the other.
The binomial distribution models the number of successes in a fixed number of independent trials with the same probability of success.
The normal distribution is a continuous probability distribution that is symmetric and bell-shaped, characterized by its mean and standard deviation.
A z-score is calculated as \(z = \frac{X - \mu}{\sigma}\), measuring how many standard deviations a value X is from the mean μ.
The complement rule states that P(Ac) = 1 - P(A), where Ac is the complement of event A.
Discrete random variables take countable values, while continuous random variables take any value in an interval.
A probability distribution describes how probabilities are assigned to each possible value of a random variable.
The law of large numbers states that as the number of trials increases, the sample mean approaches the expected value.
Mutually exclusive events cannot occur at the same time; their intersection is empty.
A probability tree diagram helps visualize and calculate probabilities of sequential events.
The mean of a binomial distribution is \(\mu = np\), where n is the number of trials and p is the probability of success.
Variance is the average squared deviation from the mean, calculated as \(\sigma^2 = E[(X - \mu)^2]\).
An unusual event is one with a low probability, often less than 5%.
The population includes all members of a group, while a sample is a subset selected for study.