 Back
BackStatistics Final Exam Concepts

 03:07
03:07
Terms in this set (23)
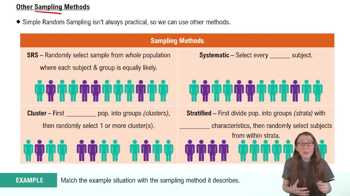
Cluster sampling involves dividing a population into clusters, randomly selecting some clusters, and surveying every member within those clusters.
Bias can occur if the clusters not chosen have different characteristics or needs than those selected.
A histogram suggests normal distribution if it is symmetric, bell-shaped, and unimodal.
A boxplot displays the median, quartiles, and potential outliers of a data set, showing its spread and skewness.
Range = max - min; Variance = average squared deviation from mean; Standard deviation = square root of variance.
High standard deviation indicates data points are spread out widely from the mean, showing high variability.
The complement of event A, denoted P(A̅), is 1 - P(A), representing the probability that A does not occur.
For dependent events A and B, P(A and B) = P(A) × P(B|A), where P(B|A) is the probability of B given A occurred.
A Poisson distribution models the number of events occurring in a fixed interval with a known average rate and independent events.
A discrete random variable takes countable values, such as number of pages or languages spoken.
A continuous random variable takes any value within an interval, such as time or amount of milk produced.
A uniform distribution has equal probability for all values within a specified range.
The area to the left of a point \(x_0\) is the percentile rank, expected proportion of observations ≤ \(x_0\), and the cumulative probability.
Measurements like lengths of pencils in a box are likely to follow a normal distribution.
The sample mean distribution approaches normality as sample size increases, regardless of population distribution.
A confidence interval estimates a population parameter with a range of values and a confidence level.
Point estimate = midpoint of interval; Margin of error = half the width of the interval.
Chi-square distribution is used in tests of variance and goodness-of-fit for categorical data.
Sample size depends on desired confidence level and allowable error margin relative to population standard deviation.
The null hypothesis often states that the population variance or standard deviation equals a specified value.
Critical values define boundaries; rejection regions are values where the null hypothesis is rejected.
The sign test compares paired proportions to test if they differ significantly.
The F distribution is used to compare two variances in hypothesis testing.