 Back
BackStatistics Test 2 Review – Step-by-Step Study Guidance
Study Guide - Smart Notes
 Tailored notes based on your materials, expanded with key definitions, examples, and context.
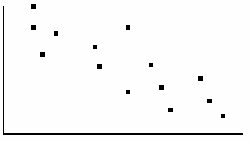
Q1. Determine if there is positive, negative, or no correlation between the x and y variables and state whether the correlation is due to coincidence, a common underlying cause, or a direct cause.
Background
Topic: Correlation and Causation
This question tests your ability to interpret scatter diagrams and understand the nature of relationships between two variables, including the direction of correlation and possible causes.
Key Terms:
Correlation: A statistical measure that describes the strength and direction of a relationship between two variables.
Positive correlation: As one variable increases, the other also increases.
Negative correlation: As one variable increases, the other decreases.
No correlation: No consistent relationship between the variables.
Causation: Indicates whether one variable directly affects the other.
Step-by-Step Guidance
Examine the scatter diagram to identify the general trend of the data points. Are they moving upward, downward, or scattered randomly?
Determine the direction of the correlation: If the points trend downward from left to right, it suggests a negative correlation; upward suggests positive correlation; random suggests no correlation.
Consider the context: Is there a logical reason why the amount of pocket change would affect test scores, or could this be a coincidence or due to a common underlying cause?
Think about whether the relationship is likely to be direct (one variable causes the other), indirect (a third variable causes both), or coincidental (no real connection).
Try solving on your own before revealing the answer!
Final Answer:
The scatter diagram shows a negative correlation between test scores and pocket change. This is likely due to coincidence, as there is no logical direct cause between these variables.
Q2. Construct a scatter diagram for the data and state whether sales and profits for these companies have no correlation, a positive correlation, or a negative correlation.
Background
Topic: Scatter Diagrams and Correlation
This question tests your ability to visualize data using a scatter diagram and interpret the relationship between two quantitative variables.
Key Terms:
Scatter diagram: A graph that shows the relationship between two variables using points.
Correlation: The direction and strength of the relationship between two variables.
Step-by-Step Guidance
List the sales and profit values for each company as ordered pairs (x = sales, y = profits).
Plot each pair on a scatter diagram, with sales on the x-axis and profits on the y-axis.
Observe the pattern of the points: Do they trend upward, downward, or are they scattered?
Based on the pattern, decide if the correlation is positive, negative, or none.
Try solving on your own before revealing the answer!
Final Answer:
The scatter diagram would show a positive correlation between sales and profits, as higher sales generally correspond to higher profits.
Q3. Does the correlation coefficient remain unchanged if interchanging the variables x and y?
Background
Topic: Properties of the Correlation Coefficient
This question tests your understanding of the mathematical properties of the correlation coefficient () and whether it is affected by swapping the variables.
Key Terms and Formula:
Correlation coefficient (): Measures the strength and direction of a linear relationship between two variables.
Step-by-Step Guidance
Recall the formula for the correlation coefficient and note the symmetry between and in the formula.
Consider what happens mathematically if you swap and in the formula.
Think about whether the value of changes or stays the same when the variables are interchanged.
Try solving on your own before revealing the answer!
Final Answer:
The correlation coefficient remains unchanged when and are interchanged, because the formula is symmetric.
Q4. Given a correlation coefficient, r = 0.8, for a scatter diagram comparing the prices of a stock, y, and U.S. employment, x. Determine how much of the variation in the stock price can be accounted for by the best-fit line.
Background
Topic: Coefficient of Determination ()
This question tests your ability to interpret the meaning of the correlation coefficient and calculate the proportion of variation explained by the regression line.
Key Terms and Formula:
Correlation coefficient (): Measures the strength of linear association.
Coefficient of determination (): Represents the proportion of variance in the dependent variable explained by the independent variable.
Step-by-Step Guidance
Identify the given correlation coefficient: .
Recall that the coefficient of determination is calculated as .
Calculate by squaring the value of .
Interpret as the proportion (or percentage) of variation in stock price explained by the best-fit line.
Try solving on your own before revealing the answer!
Final Answer:
, so 64% of the variation in stock price is explained by the best-fit line.
Q5. Given a correlation coefficient, r = -0.95, for a scatter diagram comparing the prices of item, y, and the availability of that item, x. Determine how much of the variation in the stock price can be accounted for by the best-fit line.
Background
Topic: Coefficient of Determination ()
This question tests your ability to interpret a strong negative correlation and calculate the proportion of variation explained.
Key Terms and Formula:
Correlation coefficient (): Indicates strength and direction of linear relationship.
Coefficient of determination (): Proportion of variance explained by the regression line.
Step-by-Step Guidance
Identify the given correlation coefficient: .
Recall that is calculated by squaring (ignore the sign).
Calculate and interpret as the proportion of variation explained.
Try solving on your own before revealing the answer!
Final Answer:
, so about 90.25% of the variation in stock price is explained by the best-fit line.
Q6. Given a data set with correlation coefficient r = 0.8, determine how much of the variation can be accounted for by the best-fit line.
Background
Topic: Coefficient of Determination ()
This question tests your ability to use the correlation coefficient to find the proportion of explained variance.
Key Terms and Formula:
Correlation coefficient (): Strength of linear relationship.
Coefficient of determination (): Proportion of variance explained.
Step-by-Step Guidance
Identify the given correlation coefficient: .
Calculate by squaring .
Interpret as the proportion of variation explained by the best-fit line.
Try solving on your own before revealing the answer!
Final Answer:
, so 64% of the variation is explained by the best-fit line.
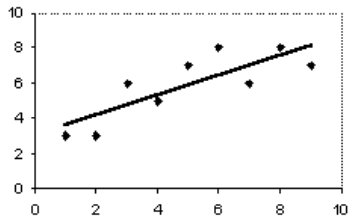
Q7. The scatter diagram and best-fit line show the data for the price of a stock (y) and U.S. Employment (x). The Correlation Coefficient r is 0.8. Predict the stock price for an employment value of 5.
Background
Topic: Linear Regression Prediction
This question tests your ability to use a regression line to make predictions based on a given value of the independent variable.
Key Terms and Formula:
Regression line: The best-fit line that models the relationship between two variables.
Prediction: Using the regression equation to estimate the dependent variable for a given independent variable.
General form:
Step-by-Step Guidance
Identify the regression equation from the scatter diagram and best-fit line (if not given, estimate from the graph).
Plug in the employment value into the regression equation.
Calculate the predicted stock price using the equation.
Try solving on your own before revealing the answer!
Final Answer:
The predicted stock price for an employment value of 5 is approximately 6 (based on the regression line).
