 Back
BackElectroanalytical and Spectroscopic Methods in Analytical Chemistry
Study Guide - Smart Notes
 Tailored notes based on your materials, expanded with key definitions, examples, and context.
Electroanalytical Methods
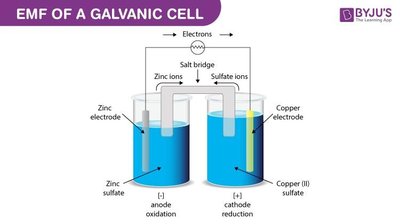
Redox Reactions and Cell Notation
Electroanalytical chemistry involves the study of chemical processes that cause electrons to move, producing an electrical signal that can be measured. Redox reactions are fundamental to these methods, as they involve the transfer of electrons between species.
Redox Reaction: A chemical reaction involving the transfer of electrons from one species (oxidation) to another (reduction).
Cell Notation: A shorthand representation of an electrochemical cell, indicating the anode (oxidation) and cathode (reduction) compartments and their respective species.
Galvanic Cell: A spontaneous electrochemical cell that generates electrical energy from a redox reaction.
Electrolytic Cell: A non-spontaneous cell that requires external electrical energy to drive a redox reaction.
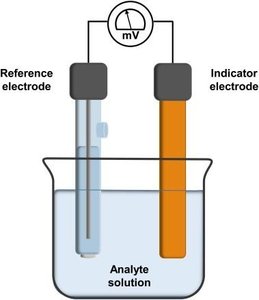
Potentiometry
Potentiometry measures the voltage of an electrochemical cell without drawing significant current. It is widely used for determining ion concentrations, such as pH measurement.
Reference Electrode: Maintains a constant potential (e.g., Standard Hydrogen Electrode, Calomel Electrode, Silver/Silver Chloride Electrode).
Indicator Electrode: Responds to the analyte of interest, generating a potential dependent on its concentration.
Cell Potential: The measured voltage is related to analyte concentration via the Nernst equation.
Nernst Equation
The Nernst equation relates the cell potential to the concentrations (activities) of the chemical species involved:
E: Cell potential under non-standard conditions
E0: Standard cell potential
n: Number of electrons transferred
[Red], [Ox]: Concentrations of reduced and oxidized species
Types of Electrodes
First Kind: Electrode is the analyte metal itself.
Second Kind: Electrode is not the analyte but is related (e.g., Ag/AgCl for Cl-).
Redox Electrodes: Inert electrodes (e.g., Pt) for redox couples.
Ion-Selective Electrodes: Glass (pH), solid-state, liquid-membrane, and gas-sensing electrodes.
Spectroscopic Methods
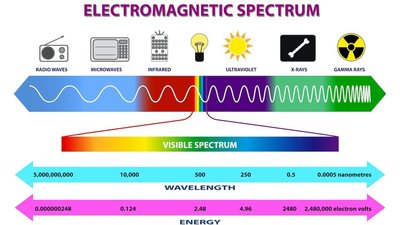
Electromagnetic Spectrum and Light
Spectroscopy studies the interaction between electromagnetic radiation and matter. The electromagnetic spectrum covers a wide range of wavelengths, from gamma rays to radio waves.
Regions: X-ray, UV-Visible, Infrared, Microwave, Radiowave
Energy Transfer: Absorption, emission, and scattering processes
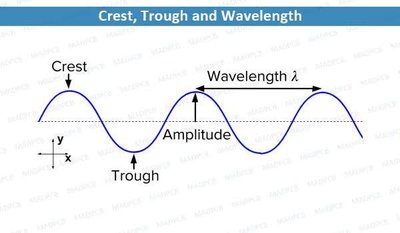
Wave Properties of Light
Light exhibits both wave-like and particle-like properties. Key wave characteristics include wavelength (λ), amplitude, crest, and trough.
Wavelength (λ): Distance between two consecutive crests or troughs.
Amplitude: Height of the wave, related to intensity.
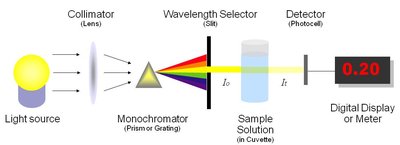
Basic Instrumentation in Spectrophotometry
Spectrophotometers measure the amount of light absorbed by a sample at specific wavelengths. The basic components include a light source, monochromator, sample holder, detector, and readout device.
Monochromator: Isolates a narrow band of wavelengths from the light source.
Detector: Measures the intensity of transmitted or emitted light.
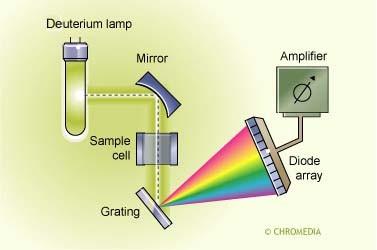
Types of UV-Vis Spectrophotometers
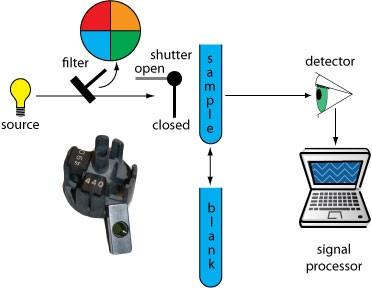
Filter Photometer: Uses optical filters to select wavelength; simple and inexpensive.
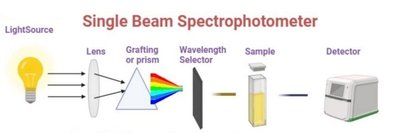
Single Beam Spectrophotometer: Measures sample and blank sequentially.
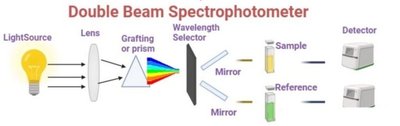
Double Beam Spectrophotometer: Simultaneously measures sample and reference for higher accuracy.
Diode Array Detector (DAD): Captures all wavelengths at once, useful for HPLC.
Infrared (IR) Spectroscopy
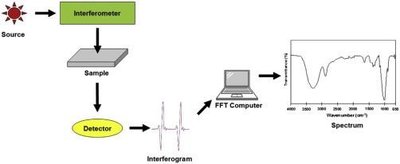
Fourier-Transform Infrared Spectroscopy (FTIR)
FTIR is used to identify and analyze materials by measuring their absorption of infrared light, producing a unique spectrum for each molecule (molecular fingerprint).
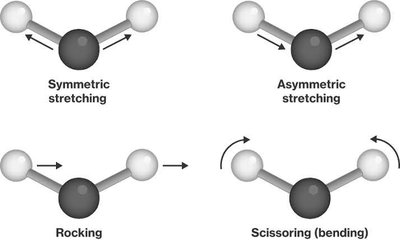
Principle: Molecules absorb IR radiation, causing vibrational transitions.
Vibrational Modes: Stretching (symmetric/asymmetric), bending (rocking, scissoring).
IR Activity: Requires a change in dipole moment during vibration.
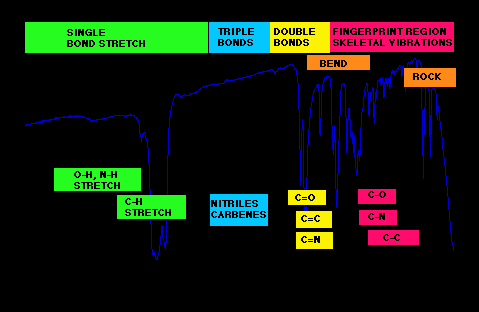
FTIR Spectrum Regions
Fingerprint Region: 600–1500 cm-1
Functional Group/Diagnostic Region: 1500–4000 cm-1
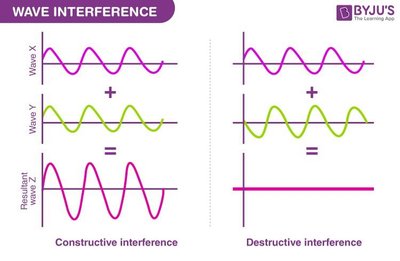
Wave Interference in FTIR
FTIR uses constructive and destructive interference to analyze the IR absorption of samples.
Fluorescence Spectroscopy
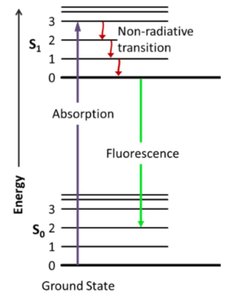
Principle and Process
Fluorescence spectroscopy measures the light emitted by substances after they absorb energy and become excited. The Jablonski diagram illustrates the process of absorption, non-radiative relaxation, and fluorescence emission.
Excitation: Sample absorbs light and electrons are promoted to an excited state.
Emission: Electrons return to the ground state, emitting light (fluorescence).
Detection: Emitted light is measured to analyze molecular structure and concentration.
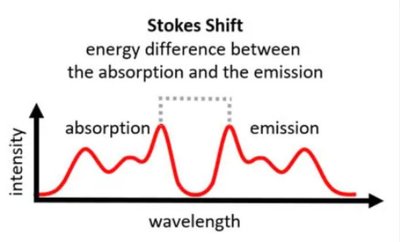
Stokes Shift
The Stokes shift is the difference between the excitation and emission wavelengths, typically 50–100 nm, due to energy loss during vibrational relaxation.
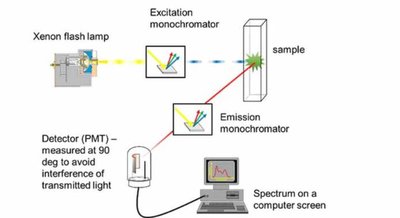
Fluorescence Instrumentation
Instrumentation includes a light source, monochromators for excitation and emission, a sample holder, and a detector (often a photomultiplier tube).
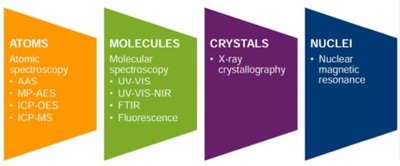
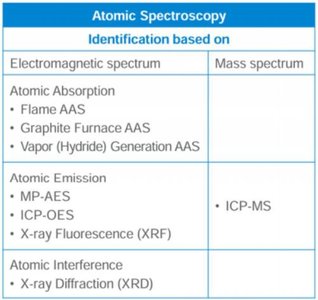
Atomic Spectroscopy
Classification and Overview
Atomic spectroscopy encompasses techniques for determining elemental composition by analyzing the interaction of atoms with electromagnetic radiation.
Atomic Absorption Spectroscopy (AAS): Measures absorption of light by ground-state atoms.
Atomic Emission Spectroscopy (AES): Measures light emitted by excited atoms.
Atomic Interference and Mass Spectrometry: Includes X-ray diffraction and ICP-MS.
Atomic Absorption Spectroscopy (AAS)
In AAS, a sample is atomized (converted to free atoms) and exposed to light of a specific wavelength. The amount of light absorbed is proportional to the concentration of the element in the sample, as described by the Beer-Lambert Law:
A: Absorbance
\varepsilon: Molar absorptivity
b: Path length
c: Concentration

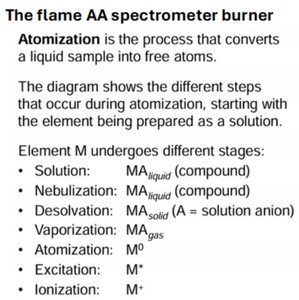
Sample Introduction and Atomization
Nebulizer: Converts liquid samples into an aerosol for introduction into the flame or furnace.
Burner: Defines the path length and region for atomization in flame AAS.
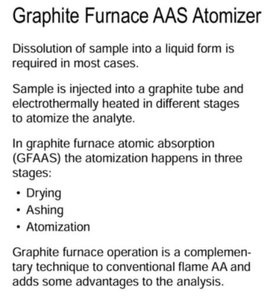
Graphite Furnace: Provides electrothermal atomization for higher sensitivity and lower detection limits.
Hydride Generator: Used for elements forming volatile hydrides (e.g., As, Se, Sb, Bi, Pb).
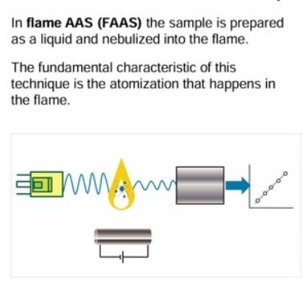
Light Source and Detection
Hollow Cathode Lamp (HCL): Emits element-specific wavelengths for absorption measurement.
Monochromator: Isolates the desired wavelength for detection.
Photomultiplier Tube (PMT): Converts light into an amplified electrical signal for quantification.
Background Correction
The Zeeman effect is used for background correction in graphite furnace AAS, employing a magnetic field to distinguish between background and analyte signals.
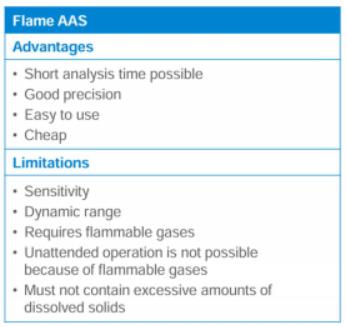
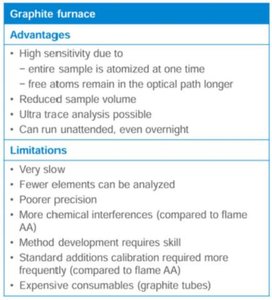
Advantages and Limitations of AAS Techniques
Technique | Advantages | Limitations |
|---|---|---|
Flame AAS | Short analysis time, good precision, easy to use, inexpensive | Lower sensitivity, requires flammable gases, limited to moderate concentrations |
Graphite Furnace AAS | High sensitivity, ultra-trace analysis, small sample volume, can run unattended | Slow, fewer elements, more chemical interferences, expensive consumables |
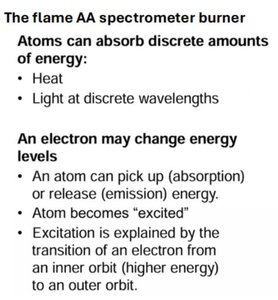
Atomic Emission Spectroscopy (AES)
AES measures the light emitted by atoms as they return from an excited state to the ground state. The intensity of emitted light is proportional to the concentration of the element.
Principle: Excited atoms emit light at characteristic wavelengths.
Applications: Used for multi-element analysis, especially in complex matrices.
Summary Table: Atomic Spectroscopy Techniques
Technique | Principle | Application |
|---|---|---|
AAS | Absorption of light by ground-state atoms | Trace metal analysis |
AES | Emission of light by excited atoms | Multi-element analysis |
ICP-MS | Ionization and mass analysis | Ultra-trace elemental analysis |
Additional info: Some explanations and tables were expanded for clarity and completeness based on standard analytical chemistry textbooks.
