 Back
Infrared Spectroscopy (IR) in Analytical Chemistry: Principles, Instrumentation, and Applications
Study Guide - Smart Notes
 Tailored notes based on your materials, expanded with key definitions, examples, and context.
Infrared Spectroscopy (IR): Principles and Overview
Introduction to IR Spectroscopy
Infrared Spectroscopy (IR) is a fundamental analytical technique used to study the interaction of infrared radiation with molecules. It is primarily employed to identify functional groups and molecular structures by analyzing the vibrational transitions of chemical bonds. The technique is widely used in both qualitative and quantitative analysis of organic and inorganic compounds.
Principle: IR spectroscopy measures the absorption of infrared light by molecules, causing bond vibrations (stretching and bending).
IR-active vibrations: Only vibrations that result in a change in dipole moment are detected.
Regions: IR is divided into near, mid, and far-infrared regions, with mid-IR (4000–400 cm-1) most commonly used for molecular analysis.
Fingerprint region: The complex pattern of absorptions in the mid-IR provides a unique 'fingerprint' for each molecule.
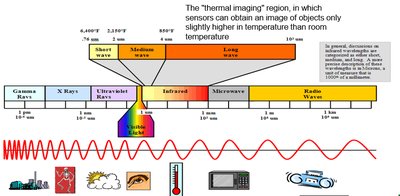
IR Spectroscopy: Instrumentation
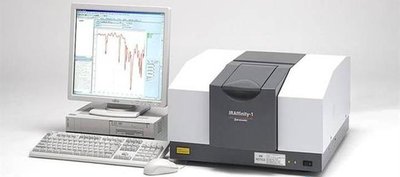
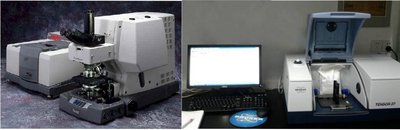
Components of an IR Spectrometer
An IR spectrometer consists of several key components, each with a specific function in the measurement process. Understanding these components is essential for interpreting IR spectra and ensuring accurate results.
Radiation Source: Provides IR radiation, typically using electrically heated inert solids such as Nernst glower, Globar, or incandescent wire. These sources emit IR radiation in the desired wavelength range.
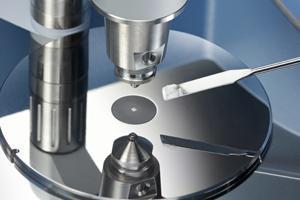
Sample Cell: Holds the sample for analysis. Solid samples are often prepared as thin discs, while liquids and gases are placed in chambers made of IR-transparent materials like NaCl or KCl.
Monochromator: Selects individual wavelengths of IR radiation for dispersive IR instruments. In FTIR (Fourier Transform Infrared) instruments, an interferometer is used instead.
Detector: Measures the intensity of IR radiation after it passes through the sample.
Computer/Data System: Processes the detector signal and generates the absorption or transmittance spectrum.
Sample Preparation Techniques
Proper sample preparation is crucial for obtaining reliable IR spectra. Different sample types require specific preparation methods to ensure optimal interaction with IR radiation.
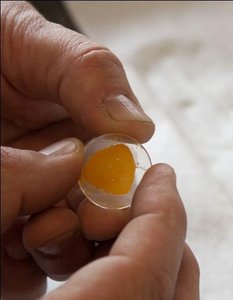
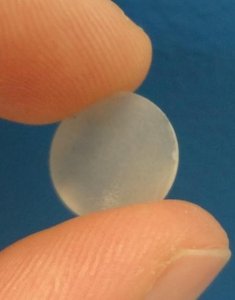
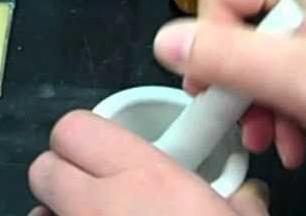
Solid Samples: Ground into fine powder, mixed with IR-grade KBr, and compressed into transparent pellets.
Liquid Samples: Placed in short pathlength cells made of NaCl or KCl; organic solvents like chloroform or carbon tetrachloride are used.
Gaseous Samples: Trapped in specialized cells for analysis.
ATR-FTIR: Attenuated Total Reflectance (ATR) allows minimal sample preparation, suitable for solids and semi-solids.
Principle of IR Absorption and Functional Group Identification
Bond Vibrations and IR Absorption
Chemical bonds in molecules behave like springs connecting atoms. When IR radiation matches the energy of a molecular vibration, the bond absorbs the radiation, resulting in stretching or bending motions. The frequency (wavenumber) of absorption is characteristic of the bond and its environment.
Stretching: Change in bond length.
Bending: Change in bond angle.
Absorption Frequency: Stronger bonds absorb at higher frequencies (wavenumbers).
Dipole Moment: Greater change in dipole moment during vibration leads to higher absorption intensity.
Functional Group Absorption Table
Different functional groups absorb IR radiation at characteristic wavenumbers, allowing identification of molecular structure.
Functional Group | Wavenumber (cm-1) | Characteristic |
|---|---|---|
Alcohol O–H | 3200–3600 | Broad |
Carboxylic acid O–H | 2500–3300 | Very broad |
N–H (amine) | 3300–3500 | One or two bands |
Alkane C–H | 2850–2960 | Multiple peaks |
Carbonyl C=O | 1650–1800 | Usually strong |
Alkene C=C | 1620–1680 | Variable |
Nitrile C≡N | 2210–2260 | Sharp |
C–O | 1000–1300 | Often strong |
Interpretation of IR Spectra
Reading IR Spectra
IR spectra display the percent transmittance or absorbance versus wavenumber. Peaks correspond to specific bond vibrations, allowing identification of functional groups and molecular structure.
Fingerprint region: 1500–400 cm-1, unique to each molecule.
Characteristic peaks: Assign functional groups based on absorption table.
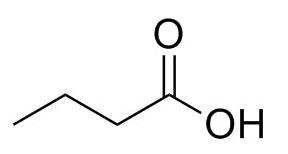
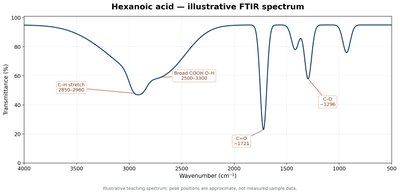
Example: Hexanoic acid shows broad O–H stretch (2500–3300 cm-1), C=O stretch (1721 cm-1), and C–O stretch (1296 cm-1).
Strengths and Limitations of IR Spectroscopy
Strengths
Functional group identification: Rapid and reliable.
Fingerprint spectrum: Unique for each compound.
Versatility: Applicable to solids, liquids, and gases.
Minimal sample preparation: Especially with ATR-FTIR.
Limitations
Overlapping bands: Can complicate interpretation.
IR-inactive vibrations: Not all bonds absorb IR.
Interference: Water and other substances may affect measurements.
Quantitative analysis: Requires calibration and controlled conditions.
Applications of IR Spectroscopy
Qualitative and Quantitative Analysis
IR spectroscopy is used for compound identification, structural confirmation, and analysis of raw materials. It is also valuable in synthetic chemistry, pharmaceutical quality control, and detection of polymorphs in drugs.
Qualitative: Identification of compounds and functional groups.
Quantitative: Measurement of concentration with calibration.
Material analysis: Films, coatings, packaging plastics.
Polymorph detection: Different crystal forms of drugs.
Summary Table: IR Spectroscopy Techniques
Aspect | IR Spectroscopy |
|---|---|
Working Principle | Absorption of IR radiation by molecular bonds, causing vibrations |
Instrumentation | IR source, sample cell, monochromator/interferometer, detector, computer |
Application | Functional group identification, structural analysis, material testing |
Sample Type/Preparation | Solid, liquid, gas; KBr pellet, liquid cell, ATR |
Sample Recovery | Usually non-destructive, but some sample forms may be altered |
Strengths | Rapid, versatile, unique fingerprint, minimal preparation |
Limitations | Overlapping bands, IR-inactive vibrations, interference, calibration needed |
Example: Interpretation of Hexanoic Acid IR Spectrum
Hexanoic acid is an organic compound with the formula C6H12O2. Its IR spectrum shows:
O–H stretch: Broad peak at 2500–3300 cm-1
C=O stretch: Strong peak at 1721 cm-1
C–O stretch: Peak at 1296 cm-1
Equations and Formulas
Wavenumber (cm-1):
Energy of IR photon:
Beer-Lambert Law (for quantitative analysis):
Additional info:
ATR-FTIR is increasingly used for rapid analysis of solid and semi-solid samples.
IR spectra interpretation requires comparison with reference tables and spectra.
