 Back
pH Meter Calibration and Acid-Base Titrations: Analytical Chemistry Laboratory Study Notes
Study Guide - Smart Notes
 Tailored notes based on your materials, expanded with key definitions, examples, and context.
pH Meter Calibration and Acid-Base Titrations
Introduction to Acid-Base Titrations
Acid-base titrations are fundamental analytical techniques used to determine the concentration, acid strength, pKa values, molecular mass, and the number of ionizable protons in a substance. These titrations are especially useful for identifying whether a substance is monoprotic, diprotic, or triprotic, and for calculating molecular mass and pKa values. The endpoint of an acid-base titration can be monitored using colorimetric indicators or, more precisely, with a pH meter and glass electrode.
Monoprotic acids donate one proton per molecule; polyprotic acids (e.g., diprotic, triprotic) donate more than one.
The equivalence point is when the amount of titrant added is stoichiometrically equivalent to the amount of analyte in solution.
The pH meter provides a quantitative method for monitoring titrations, allowing for precise determination of equivalence and half-equivalence points.
Titration Curves and Their Interpretation
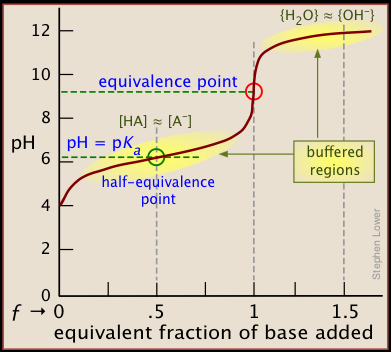
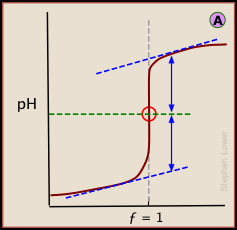
A titration curve plots the pH of a solution as a function of the quantity of base added. The curve provides insight into the acid's properties and the titration process.
Titration curve: pH vs. volume (or equivalent fraction) of base added.
Equivalence fraction (f): Number of moles of base added per mole of acid present.
Equivalence point (f = 1): All acid has reacted with base; for monoprotic acids, [HA] = 0, [A-] = initial moles of HA.
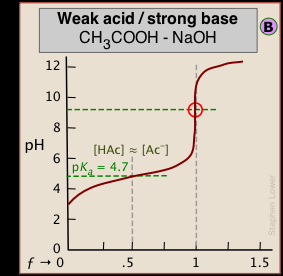
Half-equivalence point (f = 0.5): [HA] = [A-]; pH = pKa (for weak acids).
Buffer region: The relatively flat portion of the curve where the solution resists changes in pH.
Strong Acid/Strong Base vs. Weak Acid/Strong Base Titrations
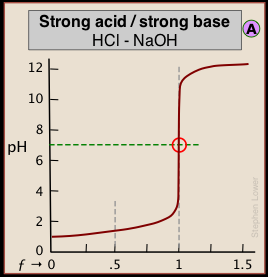
The shape and features of titration curves differ depending on the acid and base strengths involved.
Strong acid/strong base titration: The equivalence point occurs at pH 7. The curve is steep near the equivalence point, and the initial pH is low.
Weak acid/strong base titration: The equivalence point occurs at pH > 7. The initial pH is higher, and the vertical rise near the equivalence point is less pronounced. The pKa can be estimated at the half-equivalence point.
Key Equations
Henderson-Hasselbalch equation for weak acids:
At half-equivalence:
Titration Curves for Polyprotic Acids
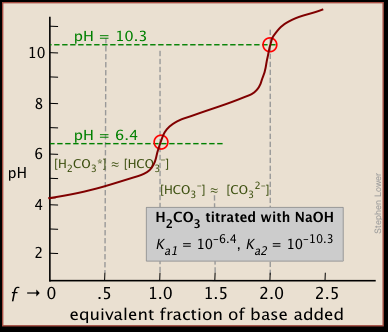
Polyprotic acids, such as carbonic acid (H2CO3), exhibit multiple equivalence points corresponding to the number of ionizable protons. Each equivalence point is associated with the complete neutralization of one acidic proton.
Diprotic acids: Two equivalence points (f = 1 and f = 2).
Each buffer region corresponds to a different acid dissociation step.
Principles Affecting Titration Curve Shape
The stronger the acid or base, the steeper the slope near the equivalence point.
The weaker the acid or base, the greater the deviation of the equivalence point pH from neutrality (pH 7).
Locating the Equivalence Point: Derivative Methods
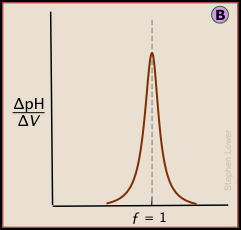
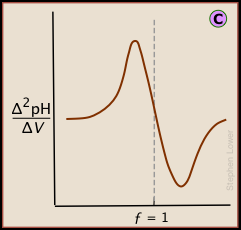
Besides visual inspection of the titration curve, the equivalence point can be determined by plotting the first or second derivatives of the titration data:
First derivative (ΔpH/ΔV): The maximum value corresponds to the equivalence point.
Second derivative (Δ2pH/ΔV2): The zero-crossing point corresponds to the equivalence point.
pH Meter: Principle and Calibration
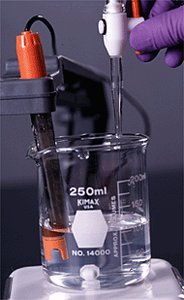
The pH meter measures the voltage produced when H+ ions in solution displace Na+ ions from a thin glass membrane. This potential difference is proportional to the hydrogen ion activity in the solution. Accurate pH measurements require regular calibration using standard buffer solutions (typically pH 4, 7, and 10).
Rinse the electrode with deionized water between measurements.
Calibrate with at least two (preferably three) buffer solutions.
Store the electrode in buffer solution when not in use.
Experimental Procedure: Titration of an Unknown Acid
The experiment involves titrating an unknown acid (which may be mono-, di-, or triprotic) with standardized NaOH, using a pH meter to monitor the reaction progress. The titration is performed in two stages: a rough titration to estimate the endpoint, followed by careful titrations for accurate data collection.
Record the volume of NaOH added for each 0.2 pH unit change (0.1 near the equivalence point).
Plot the titration curve and identify the number of equivalence points to determine acid proticity.
Calculate pKa values from the half-equivalence points.
Determine the equivalent weight (molar mass divided by number of acidic protons).
Data Analysis and Reporting
Plot the titration curve and label key points (equivalence, half-equivalence).
Identify acid proticity (mono-, di-, or triprotic) based on the number of equivalence points.
Compare experimental pKa and equivalent weight with literature values to identify the unknown acid.
Discuss differences between pH meter and indicator methods, including sources of error and advantages/disadvantages.
Comparison of Titration Methods
Indicator method: Simple, but less precise; endpoint detection can be subjective.
pH meter method: More accurate and quantitative; allows for detailed analysis of titration curves and calculation of pKa values.
Common Errors in Titration Methods
Indicator method: Color change may be ambiguous; not suitable for colored or turbid solutions.
pH meter method: Calibration drift, electrode fouling, or improper rinsing can introduce errors.
Reference Table: Dissociation Constants and pKa Values for Acids at 25°C
This table is used to compare experimental results with known acids to identify unknown samples.
Name | Formula | Ka1 | pKa1 | Ka2 | pKa2 | Ka3 | pKa3 |
|---|---|---|---|---|---|---|---|
Acetic acid | CH3COOH | 1.8 × 10⁻⁵ | 4.76 | ||||
Carbonic acid | H2CO3 | 4.5 × 10⁻⁷ | 6.35 | 4.7 × 10⁻¹¹ | 10.33 | ||
Phosphoric acid | H3PO4 | 7.5 × 10⁻³ | 2.12 | 6.2 × 10⁻⁸ | 7.21 | 4.2 × 10⁻¹³ | 12.32 |
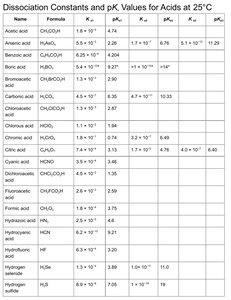
Additional info: The above table is a partial recreation; consult the full table for more acids and their dissociation constants.
