 Back
Statistical Methods and Data Analysis in Analytical Chemistry
Study Guide - Smart Notes
 Tailored notes based on your materials, expanded with key definitions, examples, and context.
Unit 1: Basics of Analytical Chemistry
The Analytical Process
The analytical process in chemistry involves formulating hypotheses, selecting appropriate sample types, and choosing suitable measurement methods. This process is foundational for quantitative analysis and ensures that results are both reliable and interpretable.
Hypothesis: A proposed explanation made on the basis of limited evidence, serving as a starting point for further investigation.
Types of Samples: Can include standards, controls, and unknowns, each serving a specific role in analysis.
Measures and Methods: Refers to the quantitative techniques and protocols used to obtain and interpret data.
Chemometrics: The application of mathematical and statistical methods to chemical data.
Basics of Statistics in Analytical Chemistry
Descriptive Statistics: Histograms, Gaussian Distributions, Mean, Median, Mode
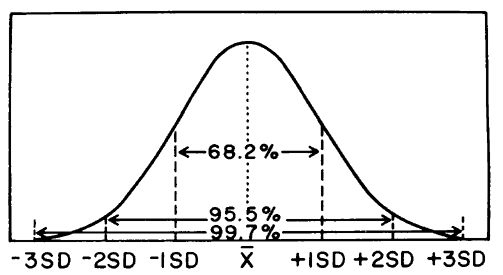
Descriptive statistics summarize and describe the main features of a dataset. Histograms visualize data distribution, while measures like mean, median, and mode provide central tendency information. The Gaussian (normal) distribution is a fundamental concept in analytical chemistry, representing the expected distribution of random errors.
Mean: The average value of a dataset.
Median: The middle value when data are ordered.
Mode: The most frequently occurring value.
Histogram: A graphical representation of data distribution.
Gaussian Distribution: A symmetric, bell-shaped curve describing the distribution of many types of random errors.
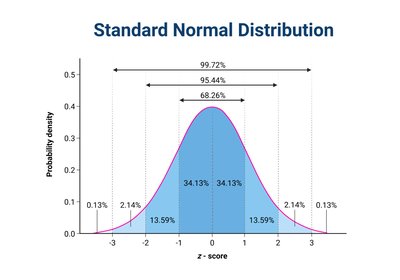
Skewness and kurtosis describe the shape of the distribution, indicating deviations from normality.
Parametric vs Non-Parametric Statistics
Parametric statistics assume that data follow a normal distribution, enabling the use of tests like the Student’s t-test and ANOVA. Non-parametric statistics are used when data do not meet these assumptions, often due to skewness or kurtosis.
Parametric Tests: Student’s t-test, ANOVA
Non-Parametric Tests: Used for skewed or non-normal data
Bootstrapping and Data Normalization
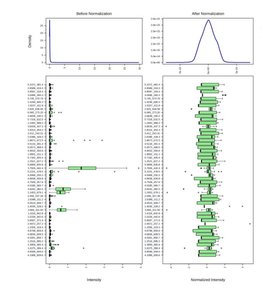
Bootstrapping is a statistical method that resamples data to estimate the distribution and confidence intervals, especially useful for skewed datasets. Normalization transforms data to fit a Gaussian curve, improving statistical analysis.
Bootstrapping: Resampling technique to estimate statistics.
Normalization: Adjusting data to conform to a normal distribution (e.g., log transform, recentering).
Statistical Errors and Data Quality
Type I and Type II Errors
Statistical errors are critical in evaluating the reliability of analytical results. Type I error (false positive) occurs when a true null hypothesis is incorrectly rejected, while Type II error (false negative) occurs when a false null hypothesis is not rejected.
Type I Error (α): Probability of rejecting a true null hypothesis.
Type II Error (β): Probability of failing to reject a false null hypothesis.
Accuracy vs Precision
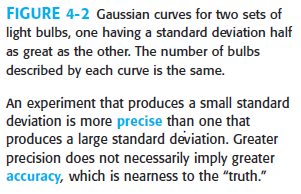
Accuracy and precision are fundamental concepts in analytical chemistry. Accuracy refers to how close measurements are to the true value, while precision describes how close measurements are to each other.
Accurate but not precise: Data points are close to the true value but not to each other.
Precise but not accurate: Data points are close to each other but not to the true value.
Accurate and precise: Data points are both close to each other and to the true value.





Note: Small error does not mean data are accurate; large error does not mean data are poor.
Ideal: Accurate and precise data are rare in practice.

Precision and Standard Deviation
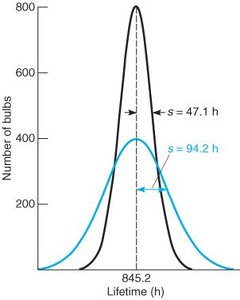
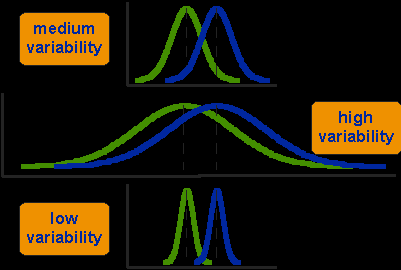
Precision is quantitatively described by the standard deviation. A smaller standard deviation indicates higher precision. However, high precision does not guarantee high accuracy.
Determining Differences: t-test, ANOVA, Regression Analysis
Student’s t-test
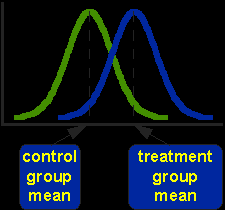
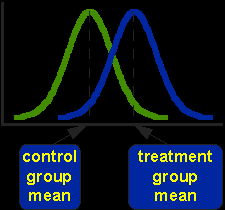
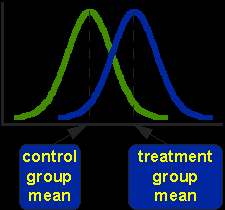
The Student’s t-test is used to determine if two sets of data are significantly different. It is especially useful for small sample sizes and is based on the t-distribution.
Developed by: W. S. Gossett (published as "A. Student")
Application: Comparing means of two groups
Formula:
Degrees of Freedom:


Significance and Confidence Intervals
Statistical significance is determined by the probability (P) that a result is due to chance. Common thresholds are P = 0.05 (5%) and P = 0.01 (1%). Confidence intervals provide a range within which the true value is expected to lie with a certain probability.
95% Confidence Interval: 1 in 20 chance of being wrong
99% Confidence Interval: 1 in 100 chance of being wrong
Formula: (for a group of results)
Formula: (for a mean result)


Power Calculation and Sample Size
Power calculations determine the number of replicates needed to achieve a desired confidence interval. The calculation depends on the expected standard deviation, effect size, significance level, and desired power.
Formula:
Effect Size (Δ): The difference you want to detect
Standard Deviation (σ): Estimated from preliminary data
Z-values: Correspond to significance level and power
Bayesian Statistics and Machine Learning in Analytical Chemistry
Bayesian Probability
Bayesian statistics incorporate prior knowledge and update probabilities as new data become available. This approach is increasingly used in analytical chemistry, especially in machine learning and artificial intelligence applications.
Bayesian Probability: Probability based on prior and current evidence
Machine Learning Algorithms: Used for pattern recognition and predictive modeling
Artificial Intelligence: Enhances data analysis and interpretation
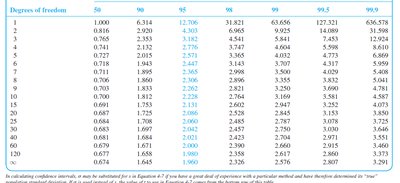
Summary Table: t Values for Confidence Intervals
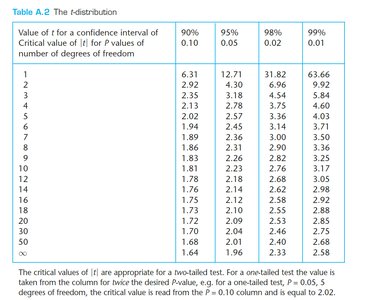
The following table summarizes critical t values for various confidence levels and degrees of freedom, essential for calculating confidence intervals and performing t-tests.
Degrees of Freedom | 90% | 95% | 98% | 99% |
|---|---|---|---|---|
1 | 6.314 | 12.706 | 31.821 | 63.657 |
2 | 2.920 | 4.303 | 6.965 | 9.925 |
3 | 1.860 | 2.776 | 4.541 | 5.841 |
4 | 1.638 | 2.447 | 3.747 | 4.604 |
5 | 1.533 | 2.262 | 3.365 | 4.032 |
10 | 1.372 | 2.228 | 2.764 | 3.169 |
20 | 1.325 | 2.086 | 2.528 | 2.845 |
30 | 1.310 | 2.042 | 2.457 | 2.750 |
∞ | 1.645 | 1.960 | 2.326 | 2.576 |

Conclusion
Statistical methods are essential for ensuring the reliability and interpretability of analytical chemistry data. Understanding concepts such as accuracy, precision, statistical errors, confidence intervals, and power calculations enables chemists to design robust experiments and make informed decisions based on their data.
