 Back
BackThin Layer Chromatography (TLC) in Analytical and Pharmaceutical Chemistry
Study Guide - Smart Notes
 Tailored notes based on your materials, expanded with key definitions, examples, and context.
Separation Science in Analytical Chemistry
Introduction to Separation Methods
Separation science encompasses a variety of techniques used to separate mixtures into their individual components. These methods are foundational in analytical chemistry, especially for the identification and quantification of substances in complex samples.
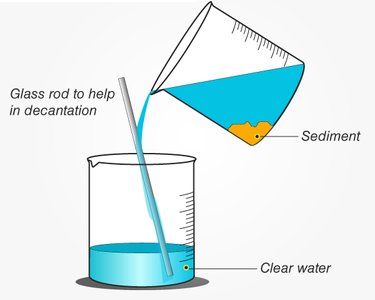
Decanting: Separates liquid from insoluble solids by gently pouring off the liquid, leaving the sediment behind.
Filtration: Uses a porous barrier to separate solids from liquids.
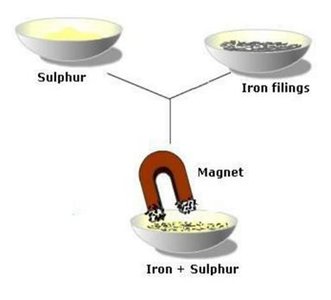
Magnetic Separation: Utilizes magnetic properties to separate magnetic materials from non-magnetic ones.
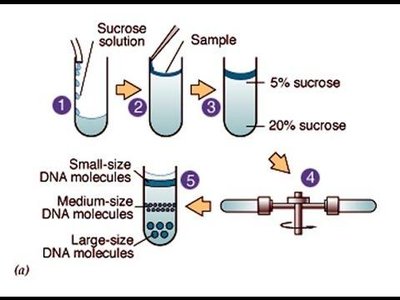
Centrifugation: Employs centrifugal force to separate substances of different densities.
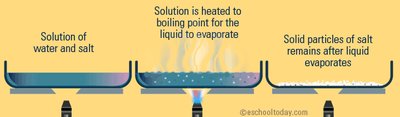
Evaporation: Removes a solvent by heating, leaving the solute behind.
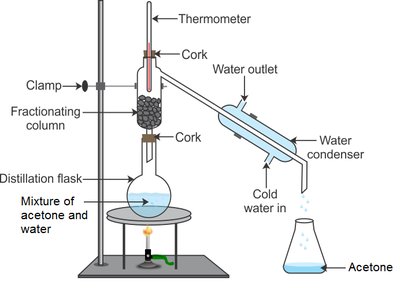
Distillation: Separates components based on differences in boiling points.
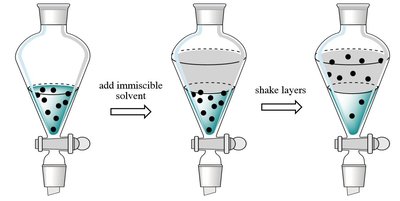
Liquid-liquid Extraction: Transfers a solute from one solvent to another based on solubility differences.
Solid-liquid Extraction: Extracts soluble compounds from solids using a suitable solvent.
Chromatography: Principles and Types
Overview of Chromatography
Chromatography is a central technique in analytical chemistry for separating and analyzing compounds in a mixture. It is based on the differential partitioning of analytes between a stationary phase and a mobile phase.
Stationary Phase: The phase that remains fixed inside the column or on a plate (e.g., silica gel).
Mobile Phase: The phase that moves through or across the stationary phase, carrying the analytes with it (e.g., solvents).
Partition Coefficient (P): The ratio of concentrations of a compound in the two phases.
The speed at which a compound moves depends on its affinity for the stationary versus the mobile phase. Compounds with higher affinity for the mobile phase migrate faster.
Key Equation:
Where and are the concentrations of compound A in the mobile and stationary phases, respectively.
Types of Chromatography
Thin Layer Chromatography (TLC): Uses a thin layer of adsorbent on a plate as the stationary phase.
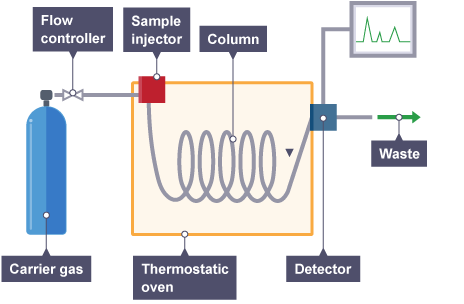
Gas Chromatography (GC): Separates volatile compounds using a gas as the mobile phase.
High Performance Liquid Chromatography (HPLC): Employs high pressure to push liquid mobile phase through a column packed with stationary phase.
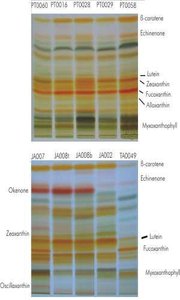
Thin Layer Chromatography (TLC)
Principles and Operation
TLC is a simple yet powerful chromatographic technique introduced in 1956. It is widely used for the identification of compounds and detection of impurities, especially in pharmaceutical analysis.
Stationary Phase: Typically a plate coated with silica gel, alumina, or cellulose.
Mobile Phase: A solvent or mixture of solvents that moves up the plate by capillary action.
Sample Application: The sample is dissolved and spotted onto the plate near the bottom (origin).
Development: The plate is placed in a chamber with the mobile phase, which ascends the plate, separating the components.
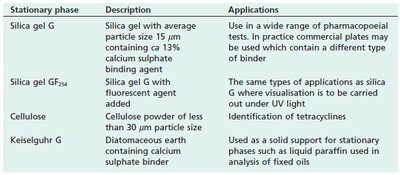
Stationary Phases in TLC
The choice of stationary phase affects the separation. Silica gel is the most common, but modifications and alternatives exist for specific applications.
Stationary phase | Description | Applications |
|---|---|---|
Silica gel G | Silica gel with average particle size 15 μm, 13% calcium sulphate binder | Wide range of pharmacopoeial tests |
Silica gel GF254 | Silica gel with fluorescent agent | Tests requiring UV light visualisation |
Cellulose | Powder <30 μm | Identification of tetracyclines |
Keiselguhr G | Diatomaceous earth with calcium sulphate binder | Analysis of fixed oils |
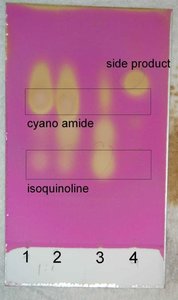
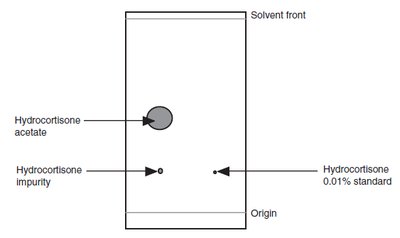
TLC Process and Separation Mechanism
More polar compounds interact more strongly with the stationary phase and thus travel shorter distances. Less polar compounds move further up the plate.
Origin: The starting point where the sample is applied.
Solvent Front: The furthest point reached by the mobile phase.
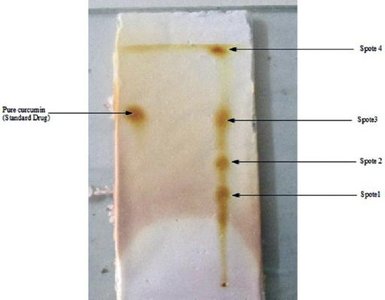
Rf Value: Quantitative Information from TLC
The Rf value (retardation factor) is a key parameter in TLC, defined as:
Rf values are characteristic for each compound under specific conditions and are used for identification and comparison.
In pharmaceutical analysis, Rf is often multiplied by 100 for reporting.
The intensity of a spot is logarithmically related to the analyte concentration, allowing semi-quantitative analysis.
Mobile Phase Selection and Optimization
The choice and polarity of the mobile phase significantly affect separation. Increasing solvent polarity generally increases Rf values for all compounds.
Solvent | Polarity Index |
|---|---|
Hexane | 0 |
Toluene | 2.4 |
Diethylether | 2.8 |
Dichloromethane | 3.1 |
Butanol | 3.9 |
Chloroform | 4.1 |
Ethyl acetate | 4.4 |
Acetone | 5.1 |
Methanol | 5.1 |
Ethanol | 5.2 |
Acetonitrile | 5.8 |
Acetic acid | 6.2 |
Water | 9.0 |
Mixing solvents allows fine-tuning of separation for complex mixtures.
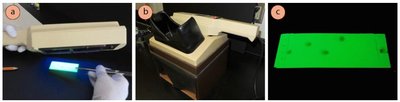
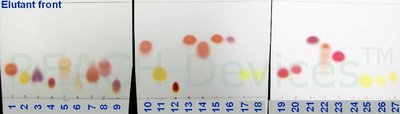
Visualisation Techniques in TLC
Most analytes are colorless and require visualization after separation. Methods include:
UV Light (254 nm): Non-destructive; spots appear as dark areas on a fluorescent background.
Iodine Vapour: General-purpose; produces brown spots with many organics.
Oxidative Stains: Permanganate (brown/yellow), cerium ammonium molybdate (dark blue) for sugars and related compounds.
Ninhydrin: Detects primary and secondary amines, producing Ruhemann's purple (used for amino acids and aminoglycoside antibiotics).
Applications of TLC in Pharmaceutical Analysis
Qualitative and Quantitative Applications
TLC is used for both qualitative identification and quantitative limit tests in pharmaceutical analysis. It is especially valuable for detecting impurities and verifying the identity of active pharmaceutical ingredients (APIs).
Identity Tests: Comparing Rf values and spot colors with standards.
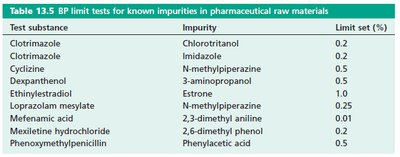
Limit Tests: Determining if impurities exceed specified thresholds.
Test substance | Impurity | Limit set (%) |
|---|---|---|
Clotrimazole | Chlorotritanol | 0.2 |
Clotrimazole | Imidazole | 0.2 |
Cyclizine | N-methylpiperazine | 0.5 |
Dexpanthenol | 3-aminopropanol | 0.5 |
Ethinylestradiol | Estrone | 1.0 |
Loprazolam mesylate | N-methylpiperazine | 0.25 |
Mefenamic acid | 2,3-dimethyl aniline | 0.01 |
Mexitilene hydrochloride | 2,6-dimethyl phenol | 0.02 |
Phenoxymethylpenicillin | Phenylacetic acid | 0.5 |
Strengths and Limitations of TLC
Advantages
Flexible: Wide choice of stationary and mobile phases, and visualization reagents.
Robust and inexpensive.
Entire chromatogram is visible for interpretation.
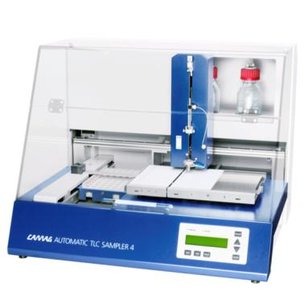
Suitable for batch analysis and automation.
Limitations
Limited number of theoretical plates (lower resolution compared to HPLC or GC).
Lower sensitivity.
Not suitable for volatile compounds.
Requires operator skill for reproducibility.
Summary of Learning Outcomes
Understanding of various separation methods in analytical chemistry.
Comprehension of chromatographic principles and terminology.
Knowledge of TLC operation, information obtained, and its applications in pharmaceutical analysis.
