 Back
BackUV-Visible Spectroscopy in Analytical Chemistry: Principles, Instrumentation, and Applications
Study Guide - Smart Notes
 Tailored notes based on your materials, expanded with key definitions, examples, and context.
Introduction to UV-Visible Spectroscopy
Overview and Importance
UV-Visible (UV-Vis) spectroscopy is a fundamental analytical technique used to study the interaction of ultraviolet and visible light with matter. It is widely applied in pharmaceutical analysis for both qualitative and quantitative determination of compounds, especially drugs that absorb in the UV-Vis region.
Spectroscopy is the study of matter by investigating the light, sound, or particles it emits, absorbs, or scatters.
It is essential in analytical chemistry for identifying and quantifying substances based on their unique absorption or emission spectra.
Principles of Spectroscopy
Electromagnetic Spectrum and Light-Matter Interaction
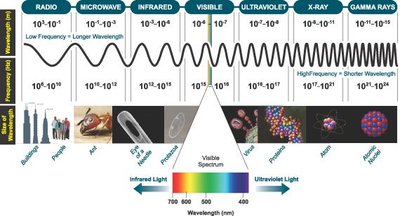
The electromagnetic spectrum encompasses all types of electromagnetic radiation, but UV-Vis spectroscopy focuses on the ultraviolet (100–380 nm) and visible (380–740 nm) regions. Human eyes detect only the visible region, but analytical instruments can measure a broader range.
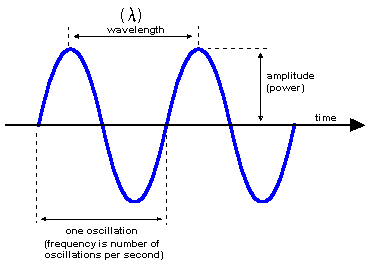
Frequency (\(\nu\)) and wavelength (\(\lambda\)) characterize spectral regions.
The velocity of light in a vacuum:
Energy of a photon:
High frequency corresponds to low wavelength and high energy, and vice versa.
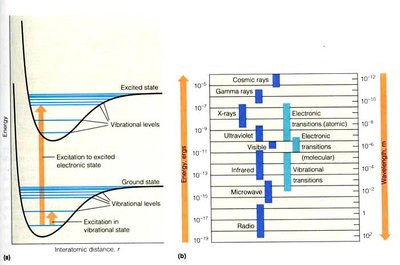
Quantum Phenomena and Molecular Absorption
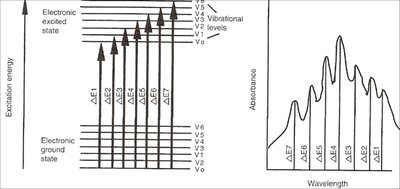
Absorption of light by molecules is a quantum phenomenon. Each molecule has characteristic energy levels, and absorption occurs when the energy of the incident light matches the energy gap (\(\Delta E\)) between these levels.
\(\Delta E = E_2 - E_1\) (difference between excited and ground states)
The absorption spectrum acts as a molecular "fingerprint" for identification and characterization.
Features of UV-Vis Spectra
Characteristics of a Spectrum
A typical UV-Vis spectrum displays the following features:
\(\lambda_{max}\): Wavelength of maximum absorption, inversely proportional to the energy of the transition.
Intensity: Proportional to the quantity of substance present.
Peak Broadness: Measured at half-height, influenced by vibrational fine structure.
Electronic Transitions and Chromophores
Different types of electronic transitions require different energies. Chromophores are molecular groups responsible for absorption in the UV-Vis region.
Electronic Transition | \(\lambda_{max}\) (nm) |
|---|---|
\(\sigma \rightarrow \sigma^*\) | ~150 |
\(n \rightarrow \sigma^*\) | ~195 |
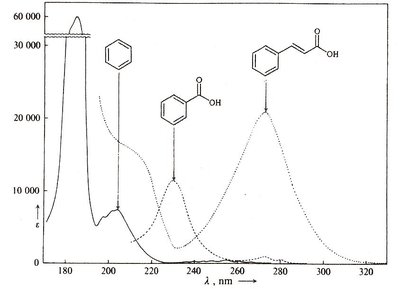
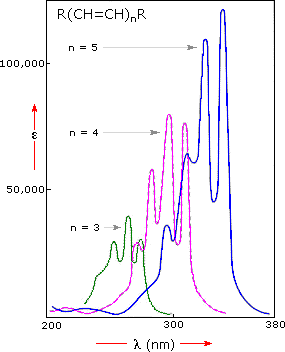
\(\pi \rightarrow \pi^*\) | ~180 (higher for conjugated systems) |
\(n \rightarrow \pi^*\) | ~300 |
Conjugation lowers the energy gap (\(\Delta E\)), shifting absorption to longer wavelengths (bathochromic shift).
Visible Region and Color
Color and Conjugation
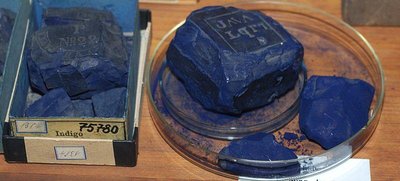
Compounds absorbing in the visible region appear colored. Highly conjugated \(\pi\)-systems, such as those in \(\beta\)-carotene and indigo, are typical chromophores responsible for visible absorption.
Wavelength (nm) | Color |
|---|---|
620–740 | Red |
590–620 | Orange |
570–590 | Yellow |
495–570 | Green |
450–495 | Blue |
380–450 | Violet |

Beer-Lambert Law and Quantitative Analysis
Absorbance and Beer-Lambert Law
Absorbance (A) is a logarithmic measure of the amount of light absorbed by a sample. The Beer-Lambert law relates absorbance to concentration:
, where is incident and is transmitted intensity.
\(\varepsilon\): molar extinction coefficient (L mol-1 cm-1)
\(l\): path length (cm)
\(c\): concentration (mol L-1)
Calibration and Analytical Process
To determine the concentration of an unknown, a calibration curve is constructed by measuring absorbance at a chosen wavelength (usually \(\lambda_{max}\)) for standards of known concentration.
Bathochromic and Hyperchromic Shifts
Types of Spectral Shifts
Bathochromic shift (Red shift): Absorption maximum moves to longer wavelength (lower energy).
Hypsochromic shift (Blue shift): Absorption maximum moves to shorter wavelength (higher energy).
Hyperchromic effect: Increased absorption intensity.
Hypochromic effect: Decreased absorption intensity.
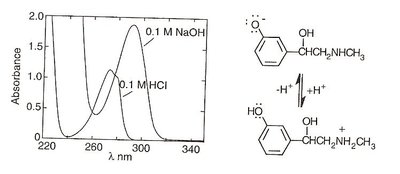
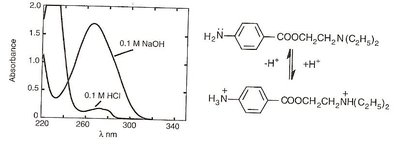
Causes include decreased symmetry, solvent changes, intermolecular interactions, auxochromes, and pH changes.
Examples of Spectral Shifts
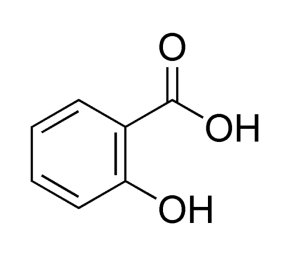
Auxochromes such as hydroxyl or amino groups can cause bathochromic and hyperchromic shifts, especially with pH changes. For example, phenylephrine and procaine show shifts depending on their protonation state.
Sample Preparation
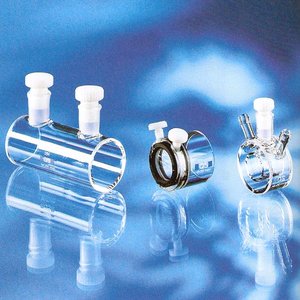
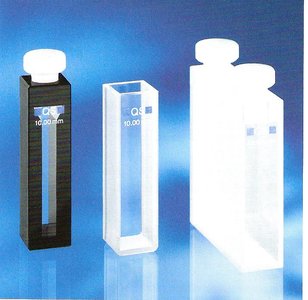
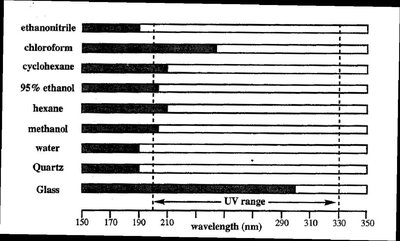
Cuvettes and Solvents
Samples are typically prepared in solutions and placed in cells or cuvettes. Quartz cuvettes are preferred for UV measurements due to their transparency. The solvent must also be transparent in the region of interest, and absorbance should be less than 2 for accuracy. A blank sample (solvent only) is used to correct for background absorption.
Instrumentation
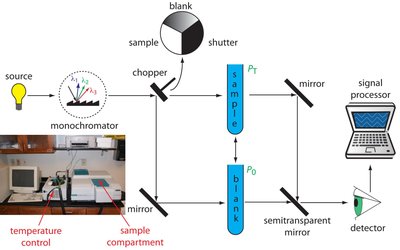
Components of a UV-Vis Spectrophotometer
Light sources: Deuterium lamp (180–350 nm, UV), Tungsten lamp (350–1000 nm, visible)
Monochromator: Prism (slow) or diffraction grating (fast) to select wavelength
Detector: Photocell and photomultiplier convert light to electrical signal
Applications in Pharmaceutical Analysis
Quantitative and Qualitative Uses
Quantitative measurement of drugs in formulations
Determination of physico-chemical properties (e.g., log P, pKa)
Monitoring drug release from formulations
Determination of pKa
pKa values can be determined by measuring absorbance at a wavelength where only one form of the analyte absorbs. The Henderson-Hasselbalch equation is adapted for absorbance measurements:
For acids:
For bases:
Where is absorbance at a given pH, is absorbance of fully ionized species, is absorbance of un-ionized species.
Advantages and Limitations
Strengths: Simple, inexpensive, robust, suitable for routine analysis.
Limitations: Moderate selectivity, not ideal for mixtures, does not identify which molecule is absorbing.
For complex mixtures or when identification is required, techniques such as High Performance Liquid Chromatography (HPLC) are used in later stages of analysis.
