 Back
BackVolumetric Titrimetry: Principles, Calculations, and Applications
Study Guide - Smart Notes
 Tailored notes based on your materials, expanded with key definitions, examples, and context.
Volumetric Titrimetry
Introduction to Titrimetry
Titrimetry encompasses a group of quantitative analytical methods based on determining the quantity of a reagent of known concentration required to react completely with an analyte. Volumetric titrimetry, the most common form, involves measuring the volume of a standard solution (titrant) needed for complete reaction with the analyte.
Gravimetric titrimetry: Mass of standard reagent is measured.
Coulometric titrimetry: Quantity of charge (in coulombs) required for reaction is measured.
Volumetric titrimetry: Volume of a solution of known concentration is measured.
Key Definitions
Titrant: A reagent of exactly known concentration used in titrimetric analysis.
Standard Solution: A solution of known concentration, often prepared using a primary standard.
Titration: The process of adding a standard reagent to an analyte solution until the reaction is complete.
Example: Determination of Chloride
Chloride ions are titrated with silver nitrate:
By measuring the volume of AgNO3 solution required, the amount of chloride can be determined.
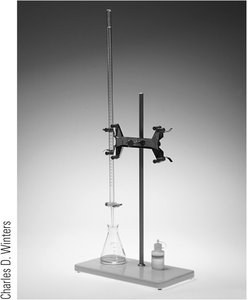
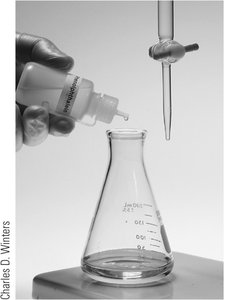
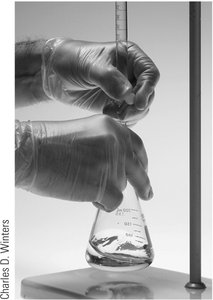
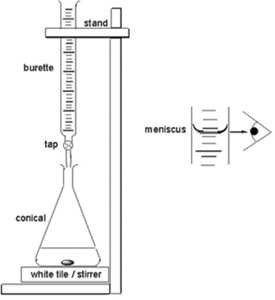
Volumetric Titrimetry Setup and Measurement
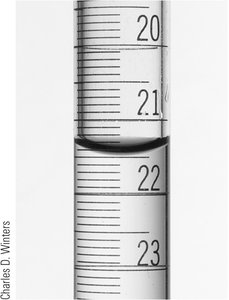
A buret is used to control and measure the volume of titrant added.
Accurate reading of the meniscus is essential for precise volume measurement.
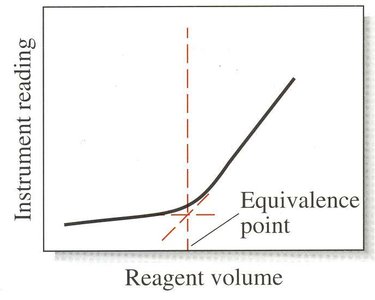
Equivalence Point and End Point
Equivalence Point: The point at which stoichiometrically equivalent amounts of analyte and titrant are present.
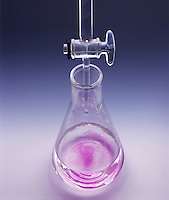
End Point: The point at which an observable physical change (e.g., color change) signals the equivalence point.
Titration Error: The difference between the end point and equivalence point volumes ().
Indicators
Indicators are chemicals that undergo a detectable change (often color) at or near the equivalence point.
Only a small amount of indicator should react to minimize titration error.
Primary and Secondary Standards
Primary Standard: A highly purified compound used to prepare or standardize a titrant. Desired properties include high purity, stability, large molar mass, and rapid, stoichiometric reaction with analyte.
Secondary Standard: A solution whose concentration is determined by titration with a primary standard.
Preparation and Standardization of Solutions
Direct Method: Weigh a primary standard, dissolve, and dilute to a known volume.
Standardization: Titrate a known mass or volume of a standard to determine the concentration of another solution.
Concentration Units and Calculations
Molarity (M): Number of moles of solute per liter of solution.
Key equations:
Stoichiometry in Titration Calculations
For a reaction:
At the end point:
To find percent analyte:
Worked Examples
Preparation of Standard Solutions: Calculate the mass of solid required to prepare a solution of desired molarity and volume.
Titration Calculations: Use titrant volume, concentration, and stoichiometry to determine analyte concentration or percent composition.
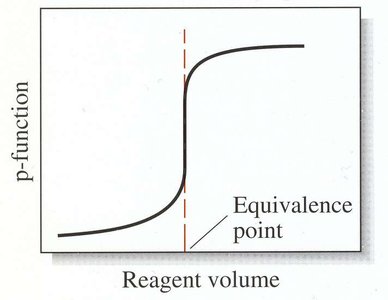
Titration Curves
Titration curves plot a concentration-related variable (e.g., pH, mV) as a function of titrant volume. They are essential for visualizing the titration process and identifying the equivalence point.
Sigmoidal Curve: Characteristic of strong acid-strong base titrations; sharp change near equivalence point.
Linear-Segmental Curve: Used for reactions complete only in excess reagent or analyte.
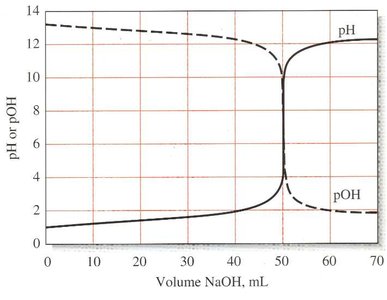
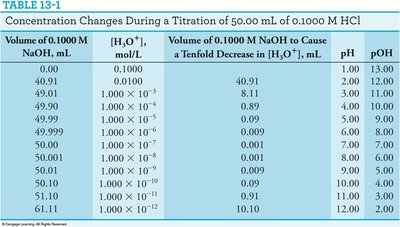
Concentration Changes During Titration
During titration, the concentrations of analyte and titrant change, especially near the equivalence point. Accurate endpoint detection is crucial due to rapid concentration changes in this region.
Summary of Basic Steps in Volumetric Titrimetry
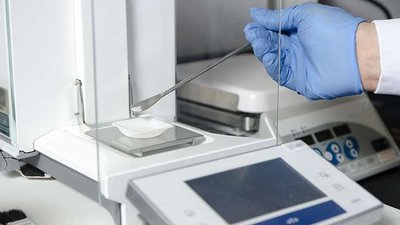
Weigh the sample accurately.
Prepare or standardize the titrant solution.
Measure the titrant volume required for reaction completion.
Apply stoichiometric relationships to calculate analyte amount or percent composition.
Endpoint Detection Methods
Chemical indicators: Detect physical changes such as color.
pH electrodes: Detect potential changes for acid-base titrations.
Table: Concentration Changes During Titration
The following table summarizes how the concentration of hydronium ion, pH, and pOH change during the titration of 50.00 mL of 0.1000 M HCl with 0.1000 M NaOH:
Volume of 0.1000 M NaOH, mL | [H3O+], mol/L | Volume of 0.1000 M NaOH to Cause a Tenfold Decrease in [H3O+], mL | pH | pOH |
|---|---|---|---|---|
0.00 | 0.1000 | 40.91 | 1.00 | 13.00 |
49.01 | 1.000 × 10⁻³ | 8.11 | 3.00 | 11.00 |
49.90 | 1.000 × 10⁻⁴ | 0.89 | 4.00 | 10.00 |
49.99 | 1.000 × 10⁻⁵ | 0.09 | 5.00 | 9.00 |
50.00 | 1.000 × 10⁻⁷ | 0.001 | 7.00 | 7.00 |
50.01 | 1.000 × 10⁻⁹ | 0.0001 | 9.00 | 5.00 |
50.10 | 1.000 × 10⁻¹⁰ | 0.009 | 10.00 | 4.00 |
51.00 | 1.000 × 10⁻¹¹ | 0.091 | 11.00 | 3.00 |
61.11 | 1.000 × 10⁻¹² | 10.19 | 12.00 | 2.00 |
Additional info:
For more complex titrations (e.g., polyprotic acids, redox titrations), similar principles apply but with more intricate stoichiometry and endpoint detection methods.
