Back
BackMetabolism, Nutrition, and Energetics: Study Notes for Anatomy & Physiology II
Study Guide - Smart Notes
 Tailored notes based on your materials, expanded with key definitions, examples, and context.
Metabolism and Nutrient Processing
Introduction to Metabolism
Metabolism encompasses all chemical reactions occurring within an organism or cell, essential for maintaining life. These reactions are divided into two main categories: catabolism (breakdown of organic substances) and anabolism (synthesis of new organic molecules). The continuous replacement of organic molecules is termed metabolic turnover.
Catabolism: Decomposition of complex molecules to release energy.
Anabolism: Synthesis of complex molecules from simpler ones, requiring energy input.
Organic molecules: Compounds containing carbon, such as carbohydrates, lipids, and proteins.
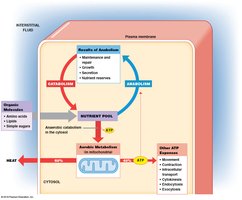
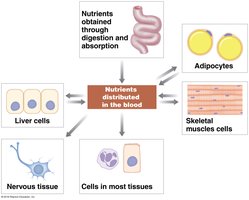
Nutrient Pool and Distribution
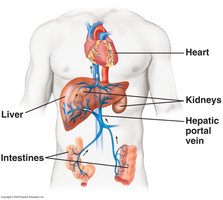
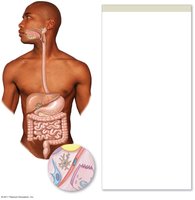
The nutrient pool refers to the accessible reserve of organic substrates used for metabolic turnover or energy production. Nutrients are absorbed by the gastrointestinal (GI) tract and distributed to various tissues. When dietary intake is insufficient, the body mobilizes energy reserves from the liver (triglycerides and glycogen), adipose tissue (triglycerides), and skeletal muscle (glycogen and proteins).
Cellular Metabolism and Energy Production
Metabolic Pathways
Cellular metabolism involves a series of metabolic pathways that convert nutrients into energy. These pathways are classified as anaerobic (not requiring oxygen) or aerobic (requiring oxygen).
Anaerobic metabolism: Occurs in the cytoplasm, does not require oxygen (e.g., glycolysis).
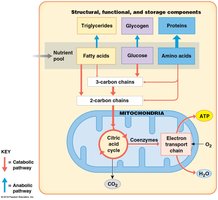
Aerobic metabolism: Occurs in mitochondria, requires oxygen (e.g., citric acid cycle, electron transport chain).
Glycolysis
Glycolysis is the anaerobic breakdown of one glucose molecule in the cytoplasm, producing a net gain of 2 ATP, 2 NADH (electron carriers), and 2 pyruvate molecules.
Location: Cytoplasm
Oxygen requirement: None
Products: 2 ATP, 2 NADH, 2 pyruvate
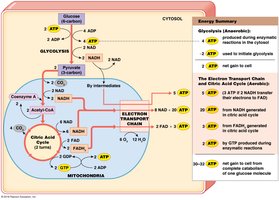
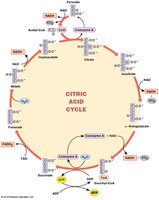
Citric Acid Cycle (Krebs Cycle)
The citric acid cycle (Krebs cycle) is an aerobic process that occurs in the mitochondria. Pyruvate from glycolysis is converted to acetyl-CoA, which enters the cycle. Each turn of the cycle produces 1 ATP, 3 NADH, and 1 FADH2 per pyruvate (2 ATP per glucose).
Location: Mitochondrial matrix
Oxygen requirement: Yes
Products (per glucose): 2 ATP, 6 NADH, 2 FADH2
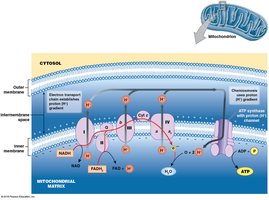
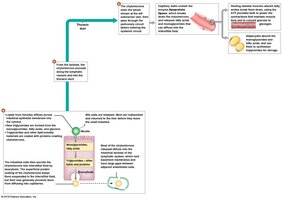
Oxidative Phosphorylation and Electron Transport Chain (ETC)
The electron transport chain (ETC) is the final stage of aerobic respiration, occurring in the inner mitochondrial membrane. It uses electrons from NADH and FADH2 to generate a proton gradient, driving ATP synthesis. Oxygen is the final electron acceptor, forming water. The ETC produces about 32 ATP per glucose molecule, accounting for over 90% of cellular ATP production.
Location: Inner mitochondrial membrane
Oxygen requirement: Yes
ATP yield: ~32 ATP per glucose
Overall ATP Yield from Glucose
One molecule of glucose generates a total of 30–32 ATP through glycolysis, the citric acid cycle, and oxidative phosphorylation.

Nutrient Metabolism
Carbohydrate Metabolism
Carbohydrates are the preferred substrate for ATP production during rest. The body stores carbohydrates as glycogen and can mobilize or synthesize glucose as needed.
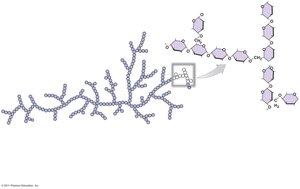
Glycogenesis: Formation of glycogen from glucose.
Glycogenolysis: Breakdown of glycogen into glucose.
Gluconeogenesis: Formation of glucose from non-carbohydrate sources (e.g., amino acids, glycerol).
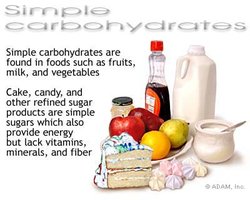
Forms of Carbohydrates
Monosaccharides: Glucose, fructose, galactose
Disaccharides: Maltose (glucose + glucose), sucrose (glucose + fructose), lactose (glucose + galactose)
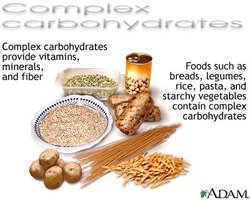
Polysaccharides: Glycogen, starch, fiber
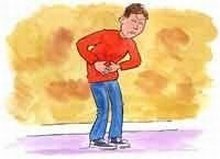
Lactose Intolerance
Lactose intolerance results from insufficient production of lactase, the enzyme required to digest lactose. Symptoms include bloating, gas, cramps, and diarrhea after consuming lactose-containing foods. Management includes avoiding lactose, using enzyme supplements, or consuming lactose-free products.
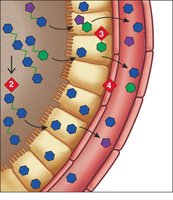
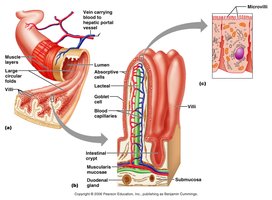
Carbohydrate Absorption and Transport
Carbohydrates are absorbed as monosaccharides in the small intestine, transported into epithelial cells, then into villi capillaries, and finally to the liver via the hepatic portal vein. The liver releases glucose into the bloodstream or stores it as glycogen.
Lipid Metabolism
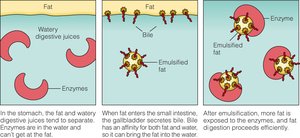
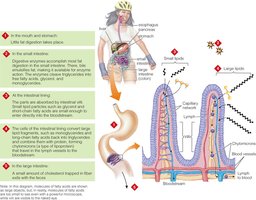
Lipid Digestion
Lipid digestion begins in the mouth with lingual lipase and continues in the stomach. In the duodenum, bile salts emulsify fats, and pancreatic lipase digests triglycerides into fatty acids and monoglycerides, which form micelles for absorption.
Lipid Absorption and Transport
Lipids from micelles diffuse into small intestine epithelial cells, where they are reassembled into triglycerides and packaged into chylomicrons. Chylomicrons enter lymphatic vessels and are transported to the bloodstream, where lipoprotein lipase releases fatty acids into tissues.

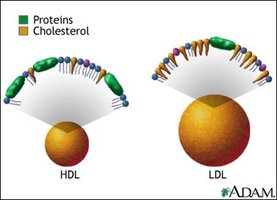
Cholesterol and Lipoproteins
Cholesterol is a sterol lipid transported in the blood by lipoproteins. Low-density lipoproteins (LDL) deliver cholesterol to tissues and are considered "bad" cholesterol, while high-density lipoproteins (HDL) remove cholesterol from tissues and are considered "good" cholesterol.
Protein Metabolism
Protein Digestion
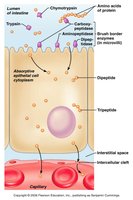
Protein digestion begins with mechanical processing in the mouth, followed by denaturation and enzymatic breakdown in the stomach (pepsin). In the duodenum, pancreatic enzymes further digest proteins into amino acids and small peptides for absorption.

Protein Absorption
Amino acids are absorbed into small intestine epithelial cells and transported to capillaries, similar to carbohydrate absorption.
States of Nutrient Absorption
Absorptive and Postabsorptive States
The absorptive state occurs after a meal when nutrients are being absorbed and stored, primarily regulated by insulin. The postabsorptive state occurs when nutrient absorption is not occurring, and the body relies on stored energy reserves, regulated by hormones such as glucagon.
Vitamins and Minerals
Vitamins
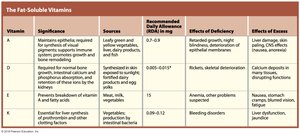
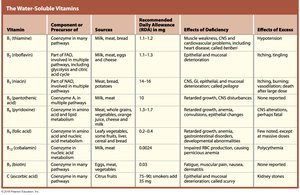
Vitamins are organic compounds required in small amounts for essential metabolic activities. They are classified as fat-soluble (A, D, E, K) or water-soluble (B vitamins and C).
Vitamin | Significance | Sources | Recommended Daily Allowance (mg) | Effects of Deficiency | Effects of Excess |
|---|---|---|---|---|---|
A | Required for synthesis of visual pigments, epithelial maintenance | Leafy greens, yellow vegetables | 0.7–0.9 | Night blindness, epithelial deterioration | Headache, nausea, liver damage |
D | Normal bone growth, calcium absorption | Sunlight, fortified dairy, egg yolks | 0.005–0.015* | Rickets, skeletal deterioration | Calcium deposits in soft tissues |
E | Prevents breakdown of vitamin A and fatty acids | Vegetables, seeds | 10–15 | Anemia, other problems | Nausea, stomach cramps, fatigue |
K | Essential for liver synthesis of prothrombin and other clotting factors | Vegetables, intestinal bacteria | 0.03–0.12 | Bleeding disorders | Liver dysfunction |
Vitamin | Component or Precursor of | Sources | Recommended Daily Allowance (mg) | Effects of Deficiency | Effects of Excess |
|---|---|---|---|---|---|
B1 (Thiamine) | Coenzyme in many pathways | Milk, meat, bread | 1.1–1.2 | Muscle weakness, CNS and cardiovascular problems | Hypotension |
B2 (Riboflavin) | Part of FAD, coenzyme in multiple pathways | Milk, meat, eggs | 1.3–1.7 | Epithelial and mucosal deterioration | Itching, tingling |
B3 (Niacin) | Part of NAD, coenzyme in multiple pathways | Meat, bread, potatoes | 13–17 | CNS, GI, epithelial, and mucosal deterioration | Vasodilation, itching, burning |
B6 (Pyridoxine) | Coenzyme in amino acid and lipid metabolism | Meat, whole grains, vegetables | 1.8–2.2 | Retarded growth, CNS problems | Fatigue, numbness, loss of coordination |
B12 (Cobalamin) | Coenzyme in nucleic acid metabolism | Milk, meat | 0.0024 | Pernicious anemia | Polycythemia |
C (Ascorbic acid) | Coenzyme, antioxidant | Citrus fruits | 75–90 | Scurvy | Kidney stones |
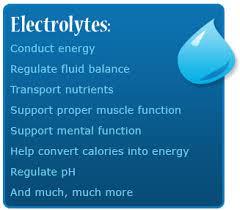
Electrolytes
Electrolytes are minerals that conduct electricity in the body, regulate fluid balance, transport nutrients, support muscle and nerve function, and help convert calories into energy.
Nutrition and Energetics
Balanced Diet
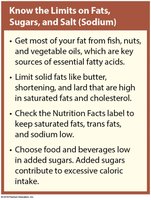
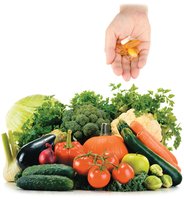
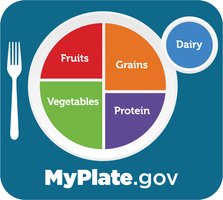
A balanced diet contains all ingredients required for homeostasis, including substrates for ATP production, essential amino acids, fatty acids, vitamins, electrolytes, and water. Dietary guidelines recommend appropriate proportions of food groups for optimal health.
Caloric Value of Nutrients
Proteins: 4 cal/g
Carbohydrates: 4 cal/g
Lipids: 9 cal/g
A calorie is the amount of energy required to raise the temperature of 1 gram of water by 1°C.
Metabolic and Eating Disorders
Eating Disorders
Anorexia nervosa: Self-induced starvation or loss of appetite, resulting in significant weight loss.
Bulimia: Binge eating followed by purging (vomiting, laxatives, diuretics); more common than anorexia.
Metabolic Disorders
Obesity: Body weight >20% above ideal; increases risk for diabetes and hypertension.
High cholesterol: Associated with low HDL and high LDL; recommended intake is under 300 mg/day.
Protein deficiency disease (e.g., Kwashiorkor): Results in edema due to low blood albumin; common in malnutrition.
Malnutrition: State of inadequate or excessive nutrient absorption.
Energetics and Appetite Regulation
Basal Metabolic Rate (BMR)
BMR is the minimum resting energy expenditure of an awake, alert person. The average is about 70 cal/hr or 1680 cal/day, but it varies with weight, size, and activity level.
Control of Appetite
Appetite is regulated by the hypothalamus, which contains feeding and satiety centers. The hormone leptin, secreted by adipose tissue, signals satiety and helps regulate energy balance. Neural signals, hormones, body temperature, and psychological factors also influence feeding behavior.
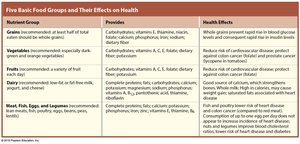
Summary Table: Five Basic Food Groups and Their Effects on Health
Nutrient Group | Provides | Health Effects |
|---|---|---|
Grains | Carbohydrates, vitamins, minerals, fiber | Rapid rise in blood glucose, reduced risk of cardiovascular disease |
Vegetables | Carbohydrates, vitamins, minerals, fiber | Reduced risk of cardiovascular disease, cancer, and obesity |
Fruits | Carbohydrates, vitamins, minerals, fiber | Reduced risk of cardiovascular disease, cancer, and obesity |
Dairy | Calcium, protein, vitamins | Bone health, reduced risk of osteoporosis |
Meat, Fish, Eggs, Legumes | Protein, vitamins, minerals | Muscle maintenance, immune function |