Skip to main content
Beginning Algebra
My Course
Learn
AI Tutor
Study Guides
Flashcards
Try the app
My Course
Learn
AI Tutor
Study Guides
Flashcards
Try the app
Back
Graph Linear Equations in Two Variables quiz
You can tap to flip the card.
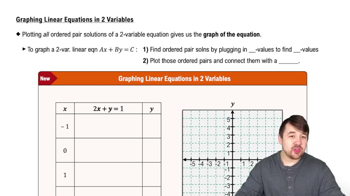
What is the general form of a linear equation in two variables?
You can tap to flip the card.
👆
What is the general form of a linear equation in two variables?
The general form is ax + by = c, where a, b, and c are constants.
Track progress
Control buttons has been changed to "navigation" mode.
1/15
Related flashcards
Recommended videos
Graph Linear Equations in Two Variables definitions
Graph Linear Equations in Two Variables
15 Terms
03:07
Graphing Linear Equations in Two Variables Example 1
57
views
02:35
Graphing Linear Equations in Two Variables Example 2
57
views
1
rank
05:51
Graphing Linear Equations in Two Variables
62
views
3
rank
Terms in this set (15)
Hide definitions
What is the general form of a linear equation in two variables?
The general form is ax + by = c, where a, b, and c are constants.
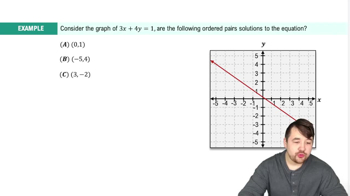
How do you find ordered pair solutions for a linear equation in two variables?
You substitute chosen x-values into the equation and solve for the corresponding y-values.
What do you do after finding ordered pairs for a linear equation?
You plot the ordered pairs on a graph and connect them with a straight line.
Why is it important to plot at least three points when graphing a linear equation?
Plotting at least three points ensures the accuracy of the line and helps show the general trend.
What does the line you draw through the plotted points represent?
The line represents all possible solutions to the linear equation in two variables.
If x-values are not given, what should you do?
You should choose your own x-values, typically values like -1, 0, 1, and 2.
What is an ordered pair in the context of graphing equations?
An ordered pair is a set of x and y values (x, y) that satisfy the equation.
How do you solve for y when given an x-value in the equation 2x + y = 1?
Substitute the x-value into the equation, then solve for y by isolating it.
What does connecting the plotted points with a line indicate about the solutions?
It shows that every point on the line is a solution to the equation, not just the plotted points.
What is the purpose of drawing arrows at the ends of the line on the graph?
Arrows indicate that the line (and thus the solutions) extends infinitely in both directions.
What should you do if you want to see the general trend of a linear equation’s graph?
Plot several ordered pairs and connect them with a line to visualize the trend.
What does the process of graphing a linear equation reinforce?
It reinforces skills in solving equations and understanding linear functions graphically.
Why might you choose x-values like -1, 0, 1, and 2 when graphing?
These values are typically close to the origin and make calculations and graphing easier.
What is the relationship between the equation ax + by = c and its graph?
The graph is a straight line showing all ordered pairs (x, y) that satisfy the equation.
Are the plotted points the only solutions to the equation?
No, every point on the line, including those between and beyond the plotted points, is a solution.
 BackBack
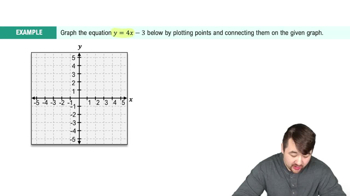
 03:07
03:07