 Back
BackRelations and Functions: Beginning-Intermediate Algebra Study Guide
Study Guide - Smart Notes
 Tailored notes based on your materials, expanded with key definitions, examples, and context.
Relations and Functions
Introduction to Relations and Functions
Relations and functions are foundational concepts in algebra, describing how inputs (often called x-values) are paired with outputs (often called y-values). Understanding these concepts is essential for analyzing mathematical relationships and solving equations.
Relation: A relation is any connection between inputs and outputs, commonly represented as a set of ordered pairs (x, y).
Function: A function is a special type of relation where each input is paired with at most one output.
Ordered Pair: An ordered pair (x, y) shows the correspondence between an input and its output.
Example: For the relation {(–2, 2), (1, 1), (3, –2), (1, 4)}, list the inputs and outputs and draw arrows showing how the values correspond.


Additional info: Relations can be represented in multiple ways: as sets of ordered pairs, tables, graphs, or equations.
Identifying Functions
To determine if a relation is a function, check whether each input is paired with only one output. This can be done by examining the set of ordered pairs or using graphical methods.
Key Point: If any input is paired with more than one output, the relation is not a function.
Example: {(–3, 5), (0, 2), (3, 5)} is a function because each input has only one output.
Example: {(2, 5), (0, 2), (2, 9)} is not a function because the input 2 is paired with two different outputs (5 and 9).
Graphical Representation and the Vertical Line Test
Graphs are a visual way to represent relations and functions. The vertical line test is a method used to determine if a graph represents a function.
Vertical Line Test: If any vertical line passes through more than one point on the graph, the graph does not represent a function.
Example: Use the vertical line test to determine if each graph is a function.
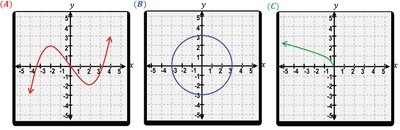
Additional info: The first and third graphs pass the vertical line test (functions), while the second (circle) does not (not a function).
Domain and Range
The domain of a relation or function is the set of all possible input values (x-values), and the range is the set of all possible output values (y-values).
Domain: All x-values in the relation or function.
Range: All y-values in the relation or function.
Example: For the relation {(–2, 2), (1, 1), (3, –2), (1, 4)}, the domain is {–2, 1, 3} and the range is {2, 1, –2, 4}.
Interval Notation: Use [ ] to include endpoints and ( ) to exclude endpoints.
Additional info: For continuous graphs, the domain and range are intervals of x and y values, respectively.
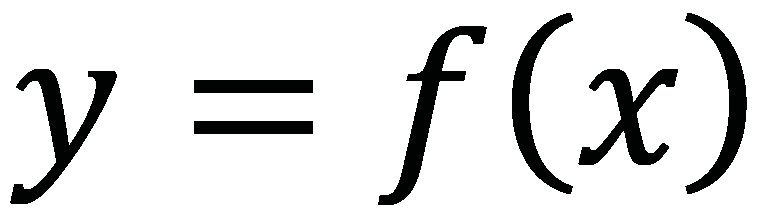
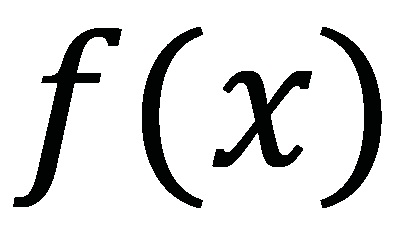
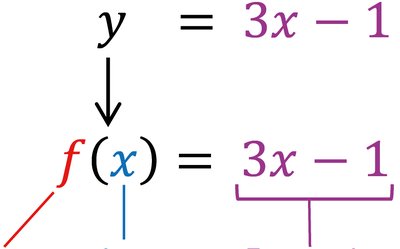
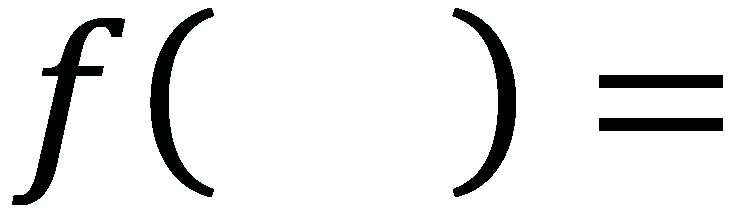
Function Notation
Function notation is a way to express functions using symbols. If an equation is a function, it is written as , read as "y equals f of x." This notation helps clarify which variable is the input and which is the output.
Function Name: The letter f (or other letters) represents the function.
Input: The variable inside the parentheses (usually x).
Expression: The rule that defines how the input is transformed into the output.
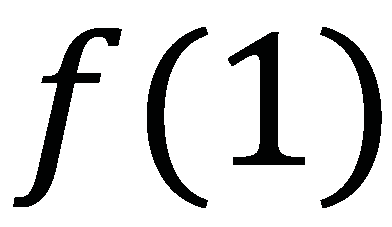
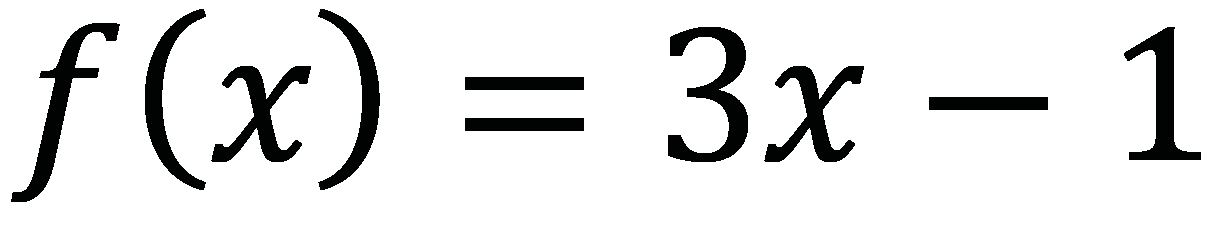
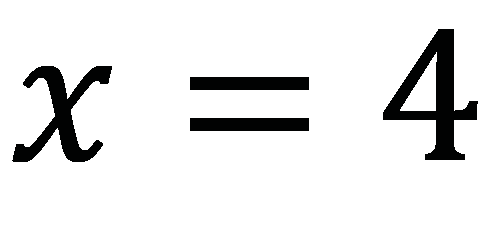
Example: ; to evaluate at , substitute 4 for x: .


Additional info: Function notation can use different letters and may omit the "of x" for simplicity.
Graphs of Common Functions
Several types of functions frequently appear in algebra, each with characteristic graphs, domains, and ranges.
Constant Function: ; output is always the same value.
Identity Function: ; output equals input.
Square Function: ; output is the square of input.
Cube Function: ; output is the cube of input.
Square Root Function: ; output is the square root of input (x must be non-negative).
Cube Root Function: ; output is the cube root of input (x can be negative).
Additional info: The domain and range depend on the function type. For example, the domain of is , while has domain .
Composition of Functions
Function composition involves combining two functions so that the output of one function becomes the input of another. This is written as .
Key Point: The result of composing functions can be a number (if evaluated at a specific value) or another function (if simplified algebraically).
Notation: means "f composed with g," or "f of g of x."
Example: If and , then .
Additional info: To evaluate a composite function at a specific value, either compose first then evaluate, or evaluate the inside function first then the outside.
Domain of Composite Functions
To find the domain of a composite function, exclude any x-values that are not defined for the inside function or that make the outside function undefined when substituted.
Step 1: Find x-values not defined for the inside function.
Step 2: Find x-values that make the outside function undefined when the inside function is substituted.
Example: If and , then , and the domain is .
Additional info: Always check both functions for domain restrictions when composing.
