It is the number of children a couple must have to replace themselves.
How did the agricultural revolution lead to an increase in human population numbers?
The agricultural revolution provided a more stable food supply, which supported larger populations and allowed for population growth.
Which of these organisms has a survivorship curve similar to that of humans? A) Frogs B) Elephants C) Insects D) Fish
B) Elephants
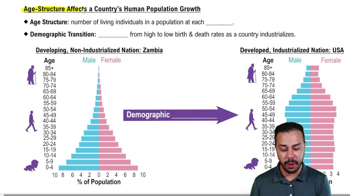
What is shown by an age structure diagram?
An age structure diagram shows the distribution of a population by age and gender, indicating the proportion of individuals in different age groups.
What might the age structure diagram of a rapidly growing population look like?
A rapidly growing population's age structure diagram would be bottom-heavy, with a large proportion of young individuals.
How has human population growth changed over the centuries?
Human population growth has surpassed exponential models due to advancements in agriculture, medicine, and technology.
How could the exponential growth of the human population impact regions throughout the world?
Exponential growth could lead to resource depletion, environmental degradation, and increased competition for resources, impacting global sustainability.
What can a human population's age pyramid tell you about current and future needs?
An age pyramid can indicate the potential need for resources such as education, healthcare, and employment, based on the proportion of young, working-age, and elderly individuals.
Which of these statements about the growth of the human population is true? A) The growth rate has been increasing since the 1960s. B) The growth rate has been decreasing since the 1960s. C) The growth rate is unaffected by voluntary population control. D) The growth rate is unaffected by density-dependent factors.
B) The growth rate has been decreasing since the 1960s.
What is the carrying capacity for humans?
The carrying capacity for humans is difficult to estimate and varies widely, but it is influenced by resource availability and ecological footprints.
What factors have contributed to the rapid increase in human population growth over the past four centuries, and why has the growth rate begun to decline since the 1960s?
Advancements in agriculture, medicine, healthcare, living conditions, and technology have accelerated human population growth beyond exponential models. Since the 1960s, the growth rate has declined due to density-dependent factors like disease and voluntary population control methods such as contraception and policies encouraging smaller families.
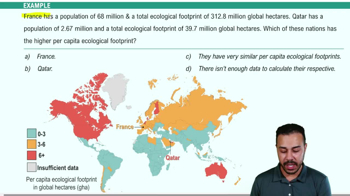
What is an ecological footprint, and what does it reveal about the sustainability of current human resource use?
An ecological footprint measures the amount of land and water needed to support human activities, expressed in global hectares (GHA). It reveals that the current average human ecological footprint (2.7 GHA per person) exceeds the maximum sustainable level (1.5 GHA per person), indicating that humans are using resources faster than nature can regenerate them, which is unsustainable.
 Back
Back

 02:36
02:36