 Back
BackAnalyzing Enzyme Activity Curves and Optimal Conditions
Study Guide - Smart Notes
 Tailored notes based on your materials, expanded with key definitions, examples, and context.
Q1. Which temperature and pH profile curves on the graphs in the figure were most likely generated from analysis of an enzyme from a human stomach, where conditions are strongly acidic?
Background
Topic: Enzyme Activity and Environmental Conditions
This question tests your understanding of how enzymes function under different temperature and pH conditions, and how these conditions relate to the natural environment of the enzyme (in this case, the human stomach).
Key Terms and Concepts:
Enzyme Activity: The rate at which an enzyme catalyzes a reaction, often affected by temperature and pH.
Optimal Temperature: The temperature at which an enzyme's activity is highest.
Optimal pH: The pH at which an enzyme's activity is highest.
Human Stomach Environment: Typically has a low (acidic) pH, around 1-2.
Step-by-Step Guidance
Examine the graph and identify which curves represent enzyme activity at different temperatures and pH values. Note the labels for each curve (e.g., 1, 2, 3, 4).
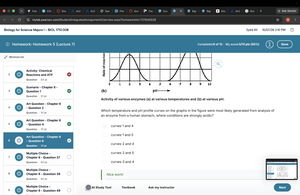
Recall that enzymes from the human stomach (such as pepsin) have optimal activity at low pH (acidic conditions) and at body temperature (around 37°C).
Look for the curve that shows the highest enzyme activity at a low pH value. This curve likely represents the pH profile for a stomach enzyme.
Next, find the temperature curve that peaks around human body temperature. This curve should represent the temperature profile for a human enzyme.
Match the correct pair of curves (one for temperature, one for pH) that fit the conditions of the human stomach. Do not select curves that peak at neutral or basic pH, or at temperatures much higher or lower than body temperature.
Try solving on your own before revealing the answer!
Final Answer: Curves 1 and 4
Curve 1 represents the temperature optimum near human body temperature, and curve 4 represents the pH optimum in the acidic range typical of the human stomach. These match the expected conditions for a stomach enzyme like pepsin.
