 Back
Behavioural Ecology and Population Ecology: Communication, Altruism, and Population Dynamics
Study Guide - Smart Notes
 Tailored notes based on your materials, expanded with key definitions, examples, and context.
Behavioural Ecology
Animal Communication
Communication in animals involves the transmission of signals that modify the behavior of other individuals. These signals can be tactile, olfactory, acoustic, or visual, and the type of signal used is often related to the organism’s habitat.
Communication: Any information-containing behavior from one individual that modifies the behavior of another.
Types of Signals: Tactile (touch), olfactory (smell), acoustic (sound), visual (sight).
Habitat Influence: The environment shapes which communication mode is most effective.
Bee Communication: The Waggle Dance
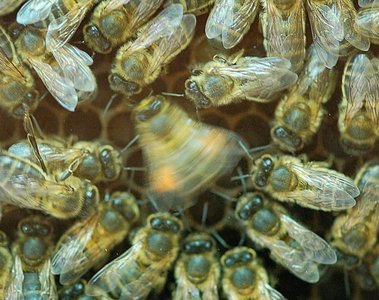
Honeybees use a sophisticated form of communication known as the waggle dance to convey information about the location of food sources. This behavior was first described by Karl von Frisch.
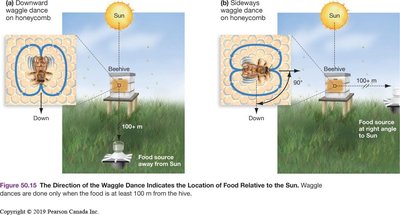
Waggle Dance: A forager bee performs a dance upon returning to the hive, indicating the direction and distance to a food source.
Key Features:
Length of waggle run = distance to feeder
Direction of waggle run = direction of food source relative to the sun
Proximate Cause: The dance encodes spatial information.
Ultimate Cause: This communication increases foraging success and has been shaped by natural selection.
Deceptive Communication
Some animals use signals to deceive others, either of the same or different species, to increase their own fitness.
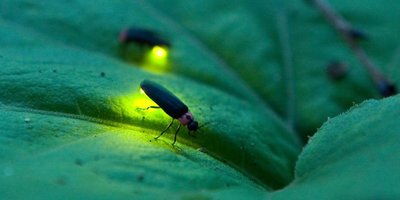
Inter-species Deception: Predatory firefly females mimic the courtship signals of other species to attract and consume males.
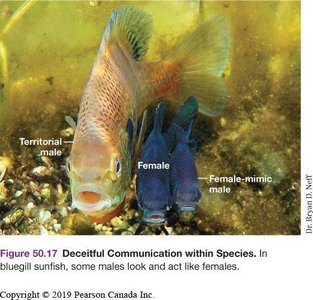
Intra-species Deception: In bluegill sunfish, some males mimic females to gain access to fertilization opportunities.
Altruism and Cooperation
Altruism in Animal Behavior
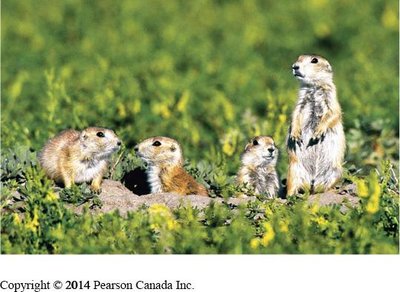
Altruism is a behavior that reduces an individual's fitness while increasing the fitness of another. This appears paradoxical because natural selection should favor alleles that increase individual fitness.
Altruism: Behavior with a fitness cost to the actor and a benefit to the recipient.
Kin Selection: Natural selection that favors altruistic behavior toward close relatives, increasing indirect fitness.
Hamilton’s Rule
Hamilton’s Rule predicts when altruistic behavior will be favored by natural selection. The rule is expressed as:
B: Fitness benefit to the recipient
r: Coefficient of relatedness (probability of sharing alleles)
C: Fitness cost to the altruist
Altruism is favored when the benefit to the recipient, weighted by relatedness, exceeds the cost to the actor.
Example Calculation: If a ground squirrel warns others, increasing the survival of two siblings by 2 offspring each (B = 4, r = 0.5), but reduces its own survival by 1 offspring (C = 1):
Thus, the behavior is favored by selection.
Coefficient of Relatedness
The coefficient of relatedness (r) quantifies the probability that two individuals share an allele due to common descent. It ranges from 0 (unrelated) to 1 (identical twins).
Parent-offspring: r = 0.5
Full siblings: r = 0.5
Calculation: For n steps in a pedigree,
Inclusive Fitness
Inclusive fitness is the sum of direct fitness (personal reproduction) and indirect fitness (helping relatives reproduce).
Direct fitness: Passing alleles to offspring
Indirect fitness: Helping relatives produce more offspring
Inclusive fitness: Direct fitness + Indirect fitness
Reciprocal Altruism
Reciprocal altruism involves the exchange of fitness benefits separated in time, often observed among unrelated individuals.
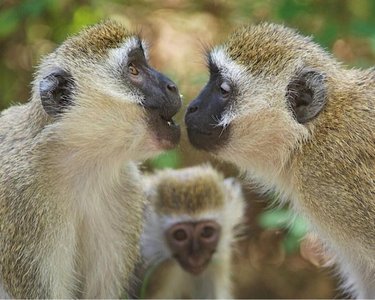
Example: Vervet monkeys are more likely to groom individuals who have groomed them in the past.
Limits of Altruism
Organisms do not act for the good of the species; they behave altruistically only if it increases their direct or inclusive fitness. Decision-making is influenced by genetic, physiological, and evolutionary mechanisms.
Population Ecology
Introduction to Population Ecology
A population is a group of individuals of the same species living in the same area at the same time. Population ecology studies how populations are distributed, change in size, and interact with their environment.
Geographic Distribution of Populations
Populations can be distributed in different patterns:
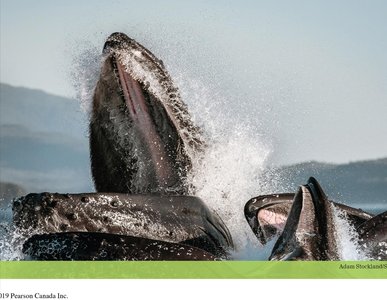
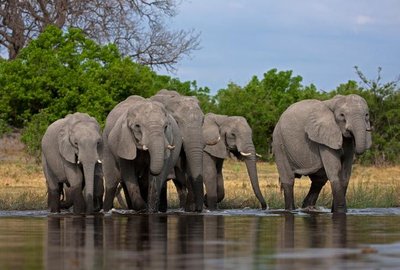
Clumped: Individuals aggregate in patches (e.g., elephants at a water source).
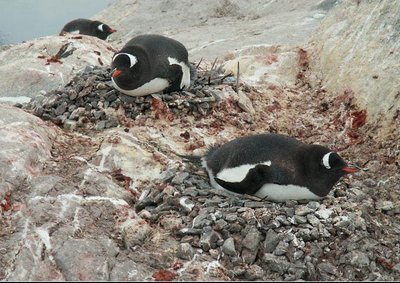
Uniform: Individuals are evenly spaced (e.g., penguins nesting).
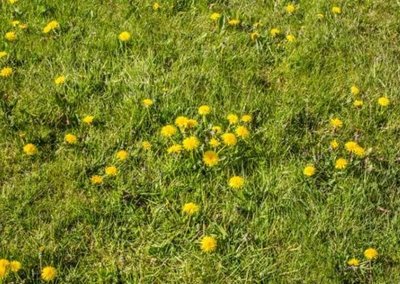
Random: Position of each individual is independent of others (e.g., dandelions in a field).
Survivorship Curves
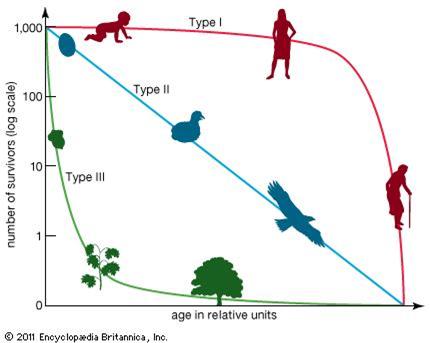
Survivorship curves describe the proportion of individuals surviving at each age:
Type I: High survivorship until old age (e.g., humans).
Type II: Constant survivorship throughout life (e.g., birds).
Type III: Low survivorship early in life, high after maturity (e.g., plants, fish).
Population Dynamics
Population dynamics examines the factors that regulate changes in population size, including birth rates, death rates, immigration, and emigration. Understanding these dynamics helps predict overpopulation, endangered species risk, and invasive species spread.
Life Tables
Life tables summarize the survival and reproductive rates of individuals in different age classes. They are essential tools for understanding population growth and identifying conservation priorities.
Age Class | Survivorship | Fecundity |
|---|---|---|
Juvenile | Low | 0 |
Young Adult | Medium | High |
Older Adult | Low | Medium |
Additional info: Life tables help prioritize which life stages to protect in conservation (e.g., adult female sea turtles).
Population Growth Equations
The change in population size over time is given by:
If no immigration or emigration occurs:
The per capita growth rate is:
Where:
N: Number of individuals
r: Per capita rate of increase
b: Per capita birth rate
d: Per capita death rate
Population growth rate:
Example: If a population of 500 mice has 125 births and 25 deaths in a year:
Intrinsic Growth Rate and Exponential Growth
The intrinsic growth rate () is the maximum rate of increase under ideal conditions. Species with rapid maturity and high fecundity have high $r_{max}$, while those with slow maturity and low fecundity have low $r_{max}$.
For continuously breeding species, population size at time t is:
Example: 12 rats introduced to an island, per month, after 4 months:
rats
