 Back
BackBIO 201 Practice Exam 2 – Step-by-Step Study Guidance
Study Guide - Smart Notes
 Tailored notes based on your materials, expanded with key definitions, examples, and context.
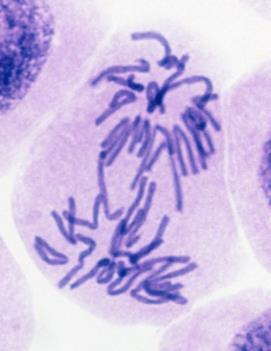
Q2. In the image to the right, you can see a living cell actively undergoing cell division, as the chromosomes are distributed to opposite sides of the cell. Based on this information, the image must have been captured by:
Background
Topic: Microscopy and Cell Division
This question tests your understanding of the differences between light and electron microscopy, and which cellular structures and processes can be visualized by each method. It also requires you to recognize what is happening in the image (cell division and chromosome movement).
Key Terms:
Light Microscopy: Allows visualization of living cells and dynamic processes, such as mitosis, at relatively low magnification and resolution.
Transmission Electron Microscopy (TEM): Provides high-resolution images of thin cell sections, but only of dead, fixed cells.
Scanning Electron Microscopy (SEM): Produces detailed 3D images of cell surfaces, but not internal structures or live processes.
Chromosomes: Structures composed of DNA and proteins, visible during cell division.
Step-by-Step Guidance
Observe the image: Notice that you can see chromosomes being separated in a living cell, which suggests the process of mitosis is being captured in real time.
Recall which microscopy techniques allow for observation of living cells and dynamic processes. Consider the limitations of electron microscopy (TEM and SEM) regarding live imaging.
Think about the resolution and type of image produced by each technique. Light microscopy can show chromosomes in dividing cells, while electron microscopy is used for higher resolution but only in dead cells.
Eliminate options that do not fit the observation of live cell division and focus on the technique that matches the image and description.
Try solving on your own before revealing the answer!
Final Answer: A. Light microscopy
Light microscopy is the only technique among the options that allows visualization of living cells actively undergoing processes like mitosis. Electron microscopy requires cells to be fixed and cannot capture live events.
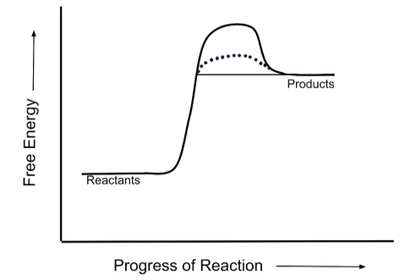
Q31. A student draws an energy diagram indicating the uncatalyzed reaction with the solid line and the enzyme-catalyzed reaction with the dotted line. What should you conclude?
Background
Topic: Enzyme Catalysis and Energy Diagrams
This question tests your ability to interpret energy diagrams and understand how enzymes affect the activation energy of chemical reactions. You need to recognize the difference between catalyzed and uncatalyzed reactions on a free energy diagram.
Key Terms and Concepts:
Activation Energy (Ea): The energy barrier that must be overcome for a reaction to proceed.
Enzyme Catalyst: Lowers the activation energy, making the reaction proceed faster, but does not change the overall free energy difference between reactants and products.
Energy Diagram: Plots free energy (y-axis) versus progress of reaction (x-axis), showing the energy profile of the reaction.
Step-by-Step Guidance
Examine the diagram: Identify which line represents the catalyzed (dotted) and uncatalyzed (solid) reactions.
Recall that enzymes lower the activation energy, so the catalyzed reaction should have a lower peak than the uncatalyzed reaction.
Check if the diagram matches this expectation: The dotted line (catalyzed) should have a lower maximum than the solid line (uncatalyzed).
Consider whether the overall free energy change (difference between reactants and products) is the same for both reactions, as enzymes do not alter this value.
Try solving on your own before revealing the answer!
Final Answer: A. The student has correctly indicated the effect of the enzyme catalyst.
The diagram correctly shows that the enzyme-catalyzed reaction (dotted line) has a lower activation energy than the uncatalyzed reaction (solid line), but the overall free energy change remains the same.
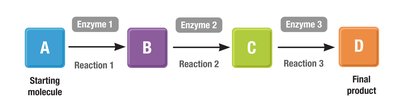
Q40. In the diagram below, if enzyme 1 is inhibited via a competitive inhibitor, what will happen?
Background
Topic: Feedback Inhibition and Metabolic Pathways
This question tests your understanding of how competitive inhibitors affect metabolic pathways, specifically how blocking the first enzyme in a pathway influences the concentrations of intermediates and products.
Key Terms and Concepts:
Competitive Inhibitor: A molecule that binds to the active site of an enzyme, preventing the substrate from binding and thus inhibiting the enzyme's activity.
Metabolic Pathway: A series of enzyme-catalyzed reactions where the product of one reaction becomes the substrate for the next.
Substrate Accumulation: If the first enzyme is inhibited, the starting molecule (A) cannot be converted to B, affecting the concentrations of all downstream products.
Step-by-Step Guidance
Identify the role of enzyme 1 in the pathway: It converts molecule A to molecule B.
Consider what happens if enzyme 1 is inhibited: The conversion of A to B slows or stops.
Predict the effect on the concentrations of A, B, C, and D: If A is not converted, what happens to the levels of each molecule?
Recall that competitive inhibition can be overcome by increasing substrate concentration, but if inhibition is strong, the pathway is effectively blocked at the first step.
Try solving on your own before revealing the answer!
Final Answer: C. The concentration of A would increase
If enzyme 1 is inhibited, molecule A cannot be converted to B, so A accumulates while the downstream products decrease.
