 Back
BackBIO 201 Practice Exam 2 Study Guidance: Cell Structure, Membranes, and Enzyme Function
Study Guide - Smart Notes
 Tailored notes based on your materials, expanded with key definitions, examples, and context.
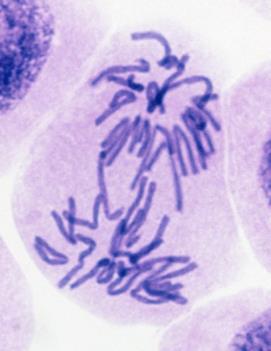
Q2. In the image to the right, you can see a living cell actively undergoing cell division, as the chromosomes are distributed to opposite sides of the cell. Based on this information, the image must have been captured by:
Background
Topic: Microscopy and Cell Division
This question tests your understanding of the differences between light and electron microscopy, and which cellular structures can be visualized by each method during cell division.
Key Terms:
Light Microscopy: Uses visible light to observe living cells and their structures.
Transmission Electron Microscopy (TEM): Uses electrons to view internal cell structures at high resolution, but cells must be dead and thinly sliced.
Scanning Electron Microscopy (SEM): Provides detailed surface images of cells, not internal structures.
Chromosomes: DNA structures visible during cell division.
Step-by-Step Guidance
Consider what is being observed: the cell is alive and actively dividing, with chromosomes visible.
Recall that light microscopy allows observation of living cells, while electron microscopy requires cells to be fixed and dead.
Think about which microscopy technique can visualize chromosomes in living cells.
Evaluate the options: TEM and SEM are not used for live cell imaging, while light microscopy is.
Try solving on your own before revealing the answer!
Final Answer: A. Light microscopy
Light microscopy is the only method listed that allows visualization of living cells and their chromosomes during cell division.
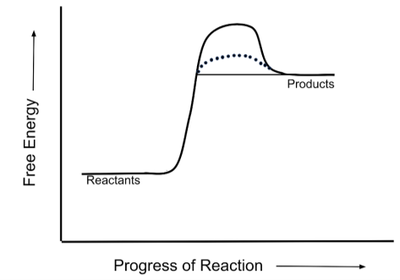
Q31. A student draws an energy diagram indicating the uncatalyzed reaction with the solid line and the enzyme-catalyzed reaction with the dotted line. What should you conclude?
Background
Topic: Enzyme Catalysis and Reaction Energy Profiles
This question tests your ability to interpret energy diagrams and understand how enzymes affect the activation energy of reactions.
Key Terms and Concepts:
Activation Energy: The energy barrier that must be overcome for a reaction to proceed.
Enzyme Catalyst: Lowers the activation energy, speeding up the reaction.
Energy Diagram: Plots free energy versus progress of reaction.
Key Formula:
Step-by-Step Guidance
Examine the diagram: the solid line shows a higher peak (activation energy) than the dotted line.
Recall that enzymes lower the activation energy, so the catalyzed reaction should have a lower peak.
Check if the reactants and products are at the same energy levels in both cases, since enzymes do not change .
Determine if the diagram correctly shows the effect of the enzyme catalyst.
Try solving on your own before revealing the answer!
Final Answer: A. The student has correctly indicated the effect of the enzyme catalyst.
The dotted line shows a lower activation energy, which is the expected effect of an enzyme.
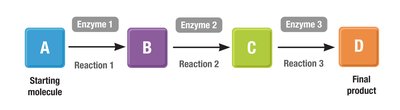
Q40. In the diagram below, if enzyme 1 is inhibited via a competitive inhibitor, what happens?
Background
Topic: Feedback Inhibition and Metabolic Pathways
This question tests your understanding of how competitive inhibitors affect metabolic pathways and the concentrations of intermediates.
Key Terms:
Competitive Inhibitor: Binds to the active site of an enzyme, blocking substrate binding.
Metabolic Pathway: Series of reactions converting a starting molecule to a final product.
Enzyme 1: Catalyzes the conversion of A to B.
Step-by-Step Guidance
Look at the pathway: A --(Enzyme 1)--> B --(Enzyme 2)--> C --(Enzyme 3)--> D.
Consider what happens if enzyme 1 is inhibited: the conversion of A to B slows down or stops.
Predict the effect on concentrations: A will accumulate, B will decrease, and downstream products (C, D) will also decrease.
Think about which molecule's concentration will increase as a result of the inhibition.
Try solving on your own before revealing the answer!
Final Answer: C. The concentration of A would increase
Inhibiting enzyme 1 prevents A from being converted to B, so A accumulates.
