 Back
BackCellular Respiration & Fermentation: Structure, Phases, and Energy Production
Study Guide - Smart Notes
 Tailored notes based on your materials, expanded with key definitions, examples, and context.
Cellular Respiration and Fermentation
Overview of Cellular Respiration
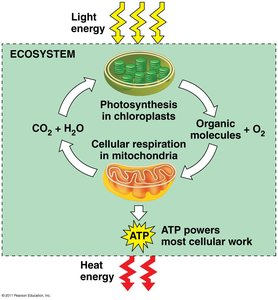
Cellular respiration is a series of catabolic pathways that break down organic molecules to produce ATP, the energy currency of the cell. It includes both aerobic (with oxygen) and anaerobic (without oxygen) processes. This process is essential for both producers and consumers in the carbon cycle, enabling the transformation of carbohydrates into usable energy and other biological molecules.
Producers: Use sunlight to convert CO2 into carbohydrates and O2, then use these carbohydrates for ATP production.
Consumers: Acquire organic compounds by eating and transform them into ATP.
Cellular Respiration: Catabolic Pathways
Cellular respiration involves the breakdown of organic molecules (carbohydrates, fats, proteins) to produce ATP. Aerobic respiration uses oxygen as the final electron acceptor, making it the most efficient pathway for ATP production.
Aerobic respiration: Occurs in most eukaryotic cells and many prokaryotes.
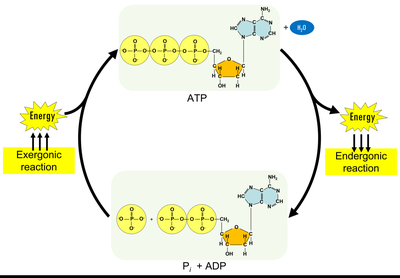
Coupling reactions: Exergonic breakdown of molecules is coupled with endergonic ATP synthesis.
Redox Reactions in Cellular Respiration
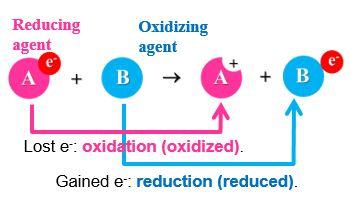
Redox reactions are central to cellular respiration, involving the transfer of electrons between molecules. Oxidation is the loss of electrons, while reduction is the gain of electrons. The reducing agent donates electrons, and the oxidizing agent accepts them.
Oxidation: Loss of electrons from a substance.
Reduction: Gain of electrons by a substance.
Reducing agent: Electron donor.
Oxidizing agent: Electron acceptor.
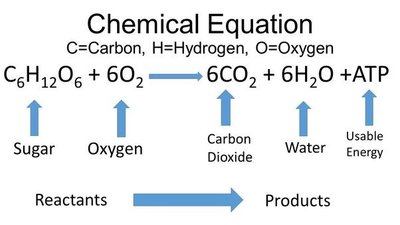
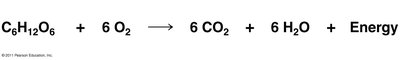
Overall Cellular Respiration Equation
The breakdown of glucose in cellular respiration is a redox reaction, where oxygen is reduced and glucose is oxidized. The overall chemical equation is:
Glucose is oxidized to CO2.
Oxygen is reduced to H2O.
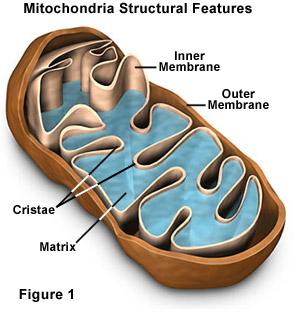
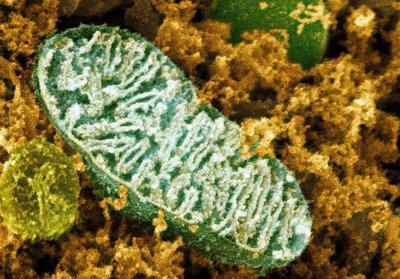
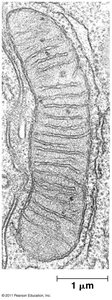
Mitochondria: The Site of Cellular Respiration
Structure and Function
Mitochondria are double-membraned organelles found in all eukaryotic cells. They are the primary site of cellular respiration, with distinct structural features that facilitate the process.
Outer membrane: Encloses the organelle.
Inner membrane: Folded into cristae, increases surface area for reactions.
Matrix: Semi-fluid interior where the citric acid cycle occurs.
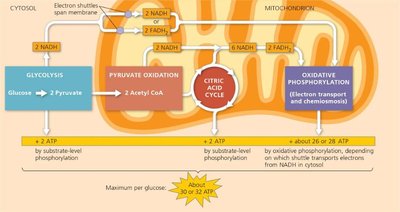
Phases of Cellular Respiration
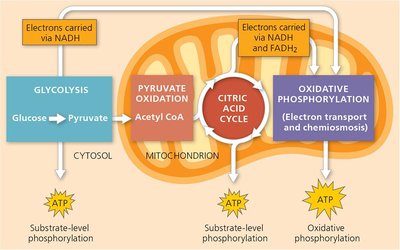
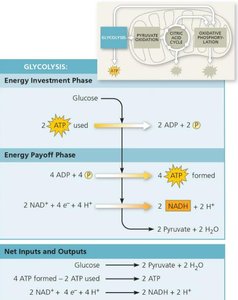
1. Glycolysis
Glycolysis is the first phase of cellular respiration, occurring in the cytoplasm. It is an anaerobic process that splits glucose into two pyruvate molecules.
Energy investment phase: Requires 2 ATP.
Energy payoff phase: Produces 4 ATP.
Net products: 2 pyruvate, 2 ATP, 2 NADH + 2 H+.
NADH: Electron carrier generated during glycolysis.
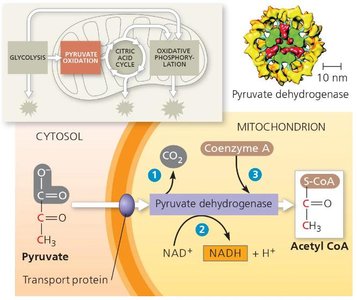
2. Pyruvate Oxidation
Pyruvate oxidation occurs in the mitochondrial matrix. Each pyruvate is converted to acetyl CoA, producing NADH and releasing CO2 as waste.
Net products per glucose: 2 CO2, 2 NADH, 2 acetyl CoA.

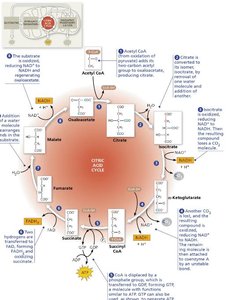
3. Citric Acid Cycle (Krebs Cycle)
The citric acid cycle is a cyclical series of reactions in the mitochondrial matrix. Acetyl CoA combines with oxaloacetate to produce ATP, NADH, FADH2, and CO2.
Oxaloacetate: Four-carbon molecule that initiates the cycle.
Net products per glucose: 6 NADH, 2 FADH2, 2 ATP, 4 CO2.
FADH2: Electron carrier produced in the cycle.
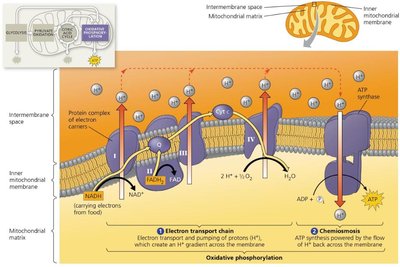
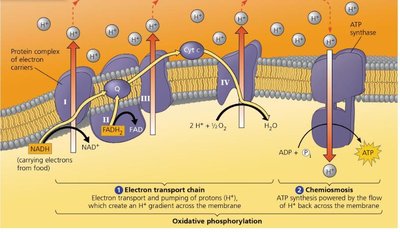
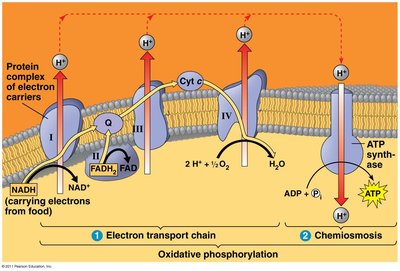
4. Oxidative Phosphorylation
Oxidative phosphorylation is the final phase, consisting of the electron transport chain and chemiosmosis. It occurs across the inner mitochondrial membrane (cristae).
Electron transport chain: NADH and FADH2 donate electrons, which are passed through membrane proteins, pumping H+ ions to create a gradient.
Final electron acceptor: O2, forming H2O.
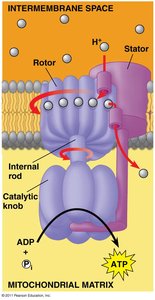
Chemiosmosis: H+ ions flow back through ATP synthase, generating ATP.
ATP yield: ~28 ATP per glucose.
Other Sources of Energy
Fatty Acids and Proteins
Cells can also use fatty acids and proteins as energy sources. Fatty acids are broken into two-carbon fragments and converted to acetyl CoA, yielding more ATP per gram than carbohydrates. Proteins are broken into amino acids, which can enter the respiration pathway at various points after removal of the amino group.
Fatty acids: Produce 2x as much ATP as carbohydrates.
Proteins: Excess amino acids are converted to intermediates of respiration.
Anaerobic Respiration and Fermentation
Anaerobic Respiration
Some bacteria can perform cellular respiration without oxygen, using alternative electron acceptors like sulfate. However, most organisms rely on fermentation in anaerobic environments.
Fermentation
Fermentation is a catabolic process that produces a limited amount of ATP from glucose without an electron transport chain. It recycles NAD+ to drive glycolysis, yielding 2 ATP per cycle.
Alcoholic fermentation: Produces ethanol and CO2 (used by yeast and some bacteria).
Lactic acid fermentation: Produces lactate (used by animal muscle cells and some bacteria).
Type of Fermentation | Products | Organisms |
|---|---|---|
Alcoholic fermentation | Ethanol + CO2 | Yeast, some bacteria |
Lactic acid fermentation | Lactate | Animals (muscle cells), some bacteria |
Summary Table: Phases of Cellular Respiration
Phase | Location | Main Reactants | Main Products | ATP Yield |
|---|---|---|---|---|
Glycolysis | Cytoplasm | Glucose | 2 Pyruvate, 2 NADH, 2 ATP | 2 ATP |
Pyruvate Oxidation | Mitochondrial Matrix | 2 Pyruvate | 2 Acetyl CoA, 2 NADH, 2 CO2 | 0 ATP |
Citric Acid Cycle | Mitochondrial Matrix | 2 Acetyl CoA | 6 NADH, 2 FADH2, 2 ATP, 4 CO2 | 2 ATP |
Oxidative Phosphorylation | Inner Mitochondrial Membrane | NADH, FADH2, O2 | H2O, ATP | ~28 ATP |
Total ATP yield per glucose: 30-32 ATP (varies by cell type and conditions).
