 Back
BackCellular Respiration: Catabolic Pathways and ATP Production
Study Guide - Smart Notes
 Tailored notes based on your materials, expanded with key definitions, examples, and context.
Cellular Respiration and Energy Transformation
Overview of Cellular Respiration
Cellular respiration is a fundamental metabolic process in both plant and animal cells, responsible for breaking down organic molecules to release energy. This energy is captured in the form of ATP, which powers most cellular activities. - Cellular respiration occurs in the mitochondria. - ATP is the primary energy currency of the cell. - Some energy is lost as heat during the process.
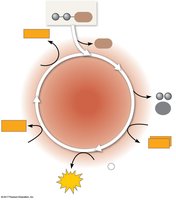
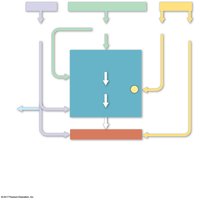
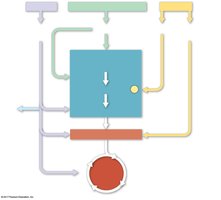
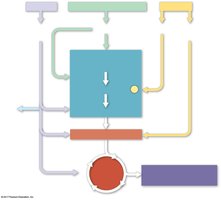
Energy Flow in Ecosystems
Energy enters ecosystems as sunlight and is eventually dissipated as heat. The chemical elements essential to life are recycled, while photosynthesis and cellular respiration are interconnected processes. - Photosynthesis produces O2 and organic molecules. - Cellular respiration uses these molecules to generate ATP.
Catabolic Pathways and ATP Production
Catabolic Pathways
Catabolic pathways release stored energy by breaking down complex molecules. Electron transfer is central to these pathways, which include fermentation, aerobic respiration, and anaerobic respiration. - Fermentation: Partial degradation of sugars without O2. - Aerobic respiration: Consumes organic molecules and O2, yielding ATP. - Anaerobic respiration: Uses compounds other than O2 as electron acceptors. 
Summary Equation for Cellular Respiration
The overall equation for aerobic cellular respiration using glucose is: 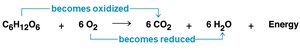
Redox Reactions in Cellular Respiration
Oxidation and Reduction
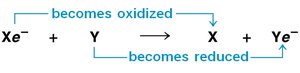
Redox reactions involve the transfer of electrons between molecules, releasing energy that is used to synthesize ATP. - Oxidation: Loss of electrons; substance is oxidized. - Reduction: Gain of electrons; substance is reduced. 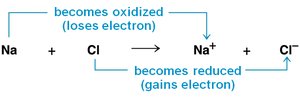
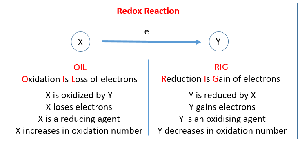
Reducing and Oxidizing Agents
- Reducing agent: Electron donor. - Oxidizing agent: Electron acceptor. 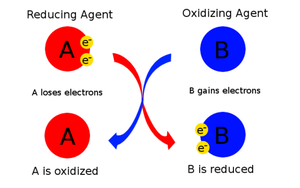
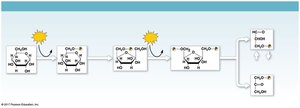
Redox Reactions in Organic Molecules
Some redox reactions change electron sharing in covalent bonds, such as the reaction between methane and O2. 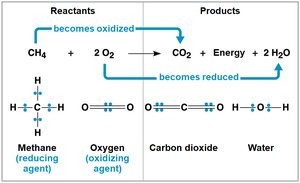
Stages of Cellular Respiration
Stepwise Energy Harvest via NAD+ and the Electron Transport Chain
Cellular respiration breaks down glucose in a series of steps. Electrons are transferred to NAD+, forming NADH, which stores energy for ATP synthesis. - NAD+: Functions as an oxidizing agent. - NADH: Represents stored energy. 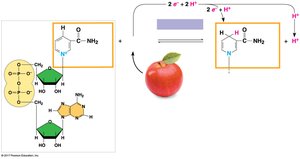
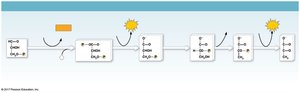
Electron Transport Chain
NADH passes electrons to the electron transport chain, which transfers electrons in a series of steps, ultimately reducing O2 and regenerating ATP. 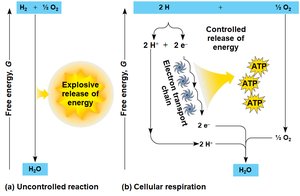
Three Stages of Cellular Respiration
1. Glycolysis: Breaks down glucose into two pyruvate molecules. 2. Citric Acid Cycle (Krebs Cycle): Completes glucose breakdown. 3. Oxidative Phosphorylation: Accounts for most ATP synthesis. 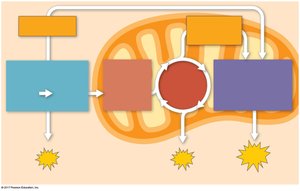
ATP Production
- Oxidative phosphorylation generates ~90% of ATP. - Substrate-level phosphorylation forms ATP in glycolysis and the citric acid cycle. 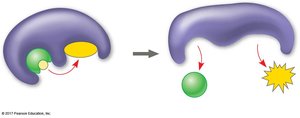
Glycolysis
Glycolysis: Energy Investment and Payoff Phases
Glycolysis occurs in the cytoplasm and consists of two phases: - Energy investment phase: 2 ATP are used. - Energy payoff phase: 4 ATP are produced, 2 NADH are formed. Net yield: 2 ATP, 2 NADH, 2 pyruvate per glucose. 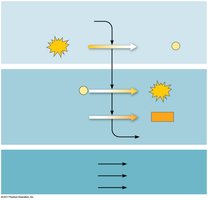
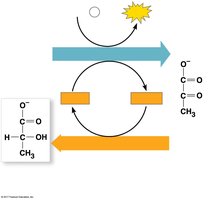
Citric Acid Cycle (Krebs Cycle)
Oxidation of Pyruvate to Acetyl CoA
Pyruvate is converted to acetyl CoA before entering the citric acid cycle. - Three reactions: Oxidation of pyruvate (CO2 released), reduction of NAD+ to NADH, combination with coenzyme A. 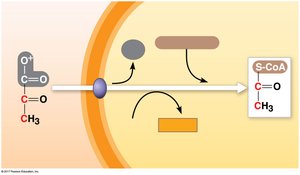
Citric Acid Cycle Steps
The cycle has eight steps, each catalyzed by a specific enzyme. - Per turn: 1 ATP, 3 NADH, 1 FADH2 produced. - Acetyl CoA combines with oxaloacetate to form citrate. 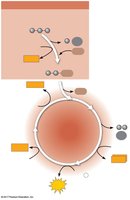
Oxidative Phosphorylation and Chemiosmosis
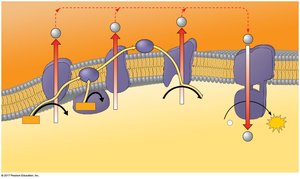
Electron Transport Chain and ATP Synthesis
The electron transport chain is located in the inner mitochondrial membrane. Electrons are transferred through protein complexes, ultimately reducing O2 to H2O. - Electron carriers alternate between reduced and oxidized states. 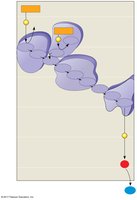
Chemiosmosis
Energy released from electron transport is used to pump H+ ions, creating a gradient. H+ flows back through ATP synthase, driving ATP production. - Proton-motive force: The H+ gradient across the membrane. 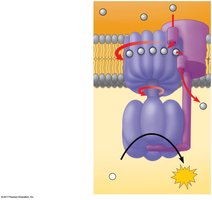
ATP Yield
- Maximum ATP per glucose: 30–32 molecules. - About 34% of glucose energy is transferred to ATP; the rest is lost as heat. 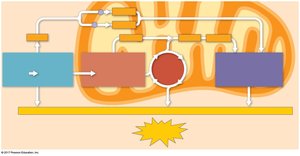
Fermentation and Anaerobic Respiration
Fermentation Types
Fermentation allows ATP production without O2. - Alcohol fermentation: Pyruvate → ethanol + CO2. - Lactic acid fermentation: Pyruvate → lactate (no CO2 released). 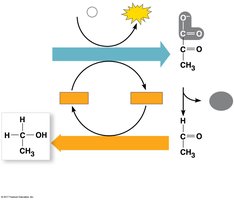
Comparison Table: Fermentation vs. Respiration
Process | Final Electron Acceptor | ATP Yield |
|---|---|---|
Fermentation | Organic molecule (e.g., pyruvate) | 2 ATP |
Anaerobic Respiration | Other than O2 (e.g., sulfate) | Variable |
Aerobic Respiration | O2 | ~32 ATP |
Metabolic Pathways and Regulation
Catabolic Pathway Versatility
Glycolysis and the citric acid cycle connect to many other metabolic pathways. - Carbohydrates, proteins, and fats can all be used as fuel. - Fats yield more ATP per gram than carbohydrates. 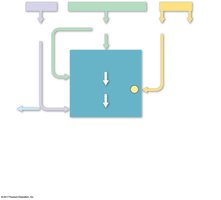
Regulation of Cellular Respiration
Feedback inhibition regulates cellular respiration. - Phosphofructokinase is a key regulatory enzyme. - High ATP inhibits, low ATP stimulates respiration. 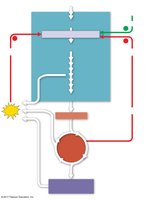
Summary Table: Key Steps and Products of Cellular Respiration
Stage | Main Location | Key Products |
|---|---|---|
Glycolysis | Cytosol | 2 ATP, 2 NADH, 2 Pyruvate |
Pyruvate Oxidation | Mitochondrial Matrix | 2 NADH, 2 Acetyl CoA, 2 CO2 |
Citric Acid Cycle | Mitochondrial Matrix | 2 ATP, 6 NADH, 2 FADH2, 4 CO2 |
Oxidative Phosphorylation | Inner Mitochondrial Membrane | ~26–28 ATP, H2O |
Evolutionary Significance
Glycolysis as an Ancient Pathway
Glycolysis is the most widespread metabolic pathway, used by early prokaryotes before O2 was present in the atmosphere. It occurs in the cytosol and does not require membrane-bound organelles. Additional info: Glycolysis is conserved across all domains of life, highlighting its evolutionary importance.
How pH Affects the H⁺ Gradient
Key Idea
pH measures the concentration of H⁺ ions.
Low pH = High H⁺ concentration (more acidic).
High pH = Low H⁺ concentration (less acidic).
During the elecgorn transport chain
NADH and FADH₂ donate electrons.
Electrons move through the electron transport chain.
The energy released is used to pump H⁺ ions from the mitochondrial matrix into the intermembrane space.
This creates:
Intermembrane space: High H⁺ → Low pH
Matrix: Low H⁺ → Higher pH
