 Back
Chapter 1: An Introduction to the Science of Life – General Biology Study Notes
Study Guide - Smart Notes
 Tailored notes based on your materials, expanded with key definitions, examples, and context.
Introduction to Biology
What is Biology?
Biology is the scientific study of life. Biologists seek to understand the natural world by investigating living organisms and their interactions. The discipline is defined by a set of properties that all living things share, which distinguishes them from nonliving matter.
Definition: Biology is the study of living organisms, their structure, function, growth, origin, evolution, and distribution.
Application: Biology helps us understand health, disease, environmental issues, and the diversity of life.
Properties of Living Things
Key Characteristics of Life
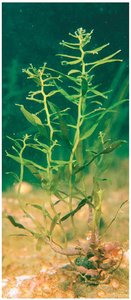
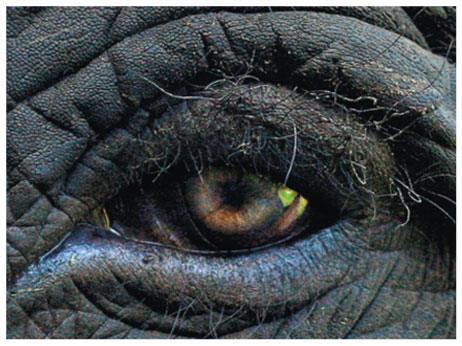
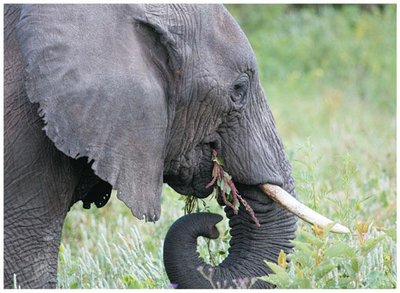
Biologists recognize life through a series of properties shared by all living things. An object is considered alive only if it displays all these properties:
Order: Living things have a complex but well-ordered structure.
Energy and Matter Processing: Organisms take in energy, convert it to useful forms, and expel energy. This includes metabolism, which is divided into:
Catabolism: Breakdown of molecules to release energy.
Anabolism: Synthesis of molecules, requiring energy.
Reproduction: All organisms reproduce their own kind.
Growth and Development: Genes control the pattern of growth and development in all organisms.
Response to the Environment: Organisms respond to environmental changes, often maintaining internal stability (homeostasis).
Evolutionary Adaptations: Traits evolve over generations, favoring individuals best suited to their environment.
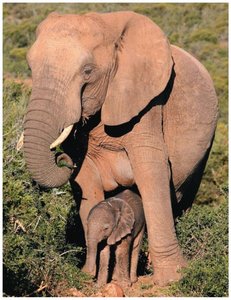
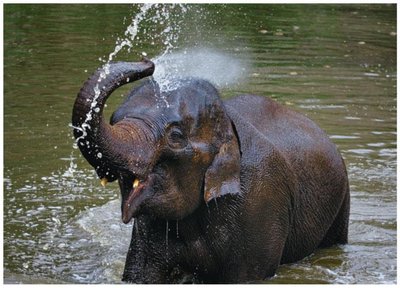
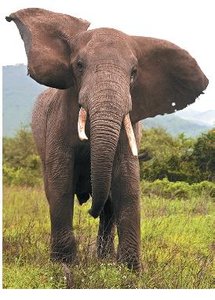
Viruses: Are They Alive?
Evaluating Life Criteria
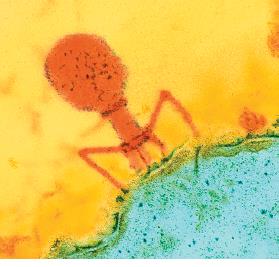
Viruses possess some properties of life, such as order and the ability to evolve. However, they cannot reproduce independently and lack several other characteristics. Most biologists agree that viruses are not alive, but exist in a state between living organisms and nonliving chemicals.
Order: Viruses are highly ordered.
Evolution: Viruses can evolve over time.
Reproduction: Viruses cannot reproduce on their own; they require a host cell.
Levels of Biological Organization
Hierarchy of Life
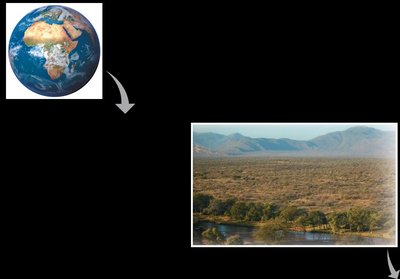
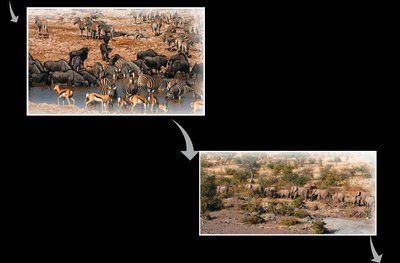
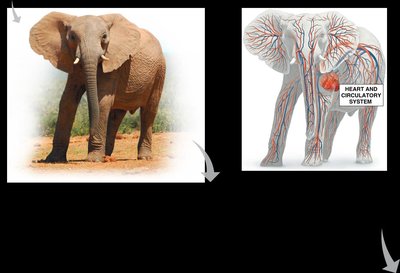
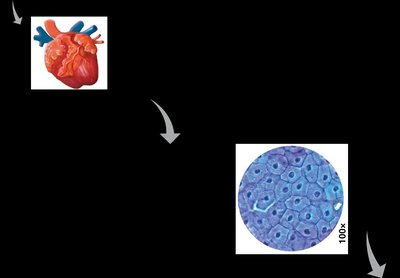
Life can be studied at many levels, from the biosphere down to atoms. Each level represents a different degree of complexity and organization.
Biosphere: All life on Earth and the environments they inhabit.
Ecosystem: All living and nonliving components in a particular area.
Community: All organisms living in an ecosystem.
Population: Individuals of one species living in a specific area.
Organism: An individual living entity.
Organ System: Groups of organs working together.
Organ: A structure composed of tissues performing a specific function.
Tissue: Groups of similar cells performing a function.
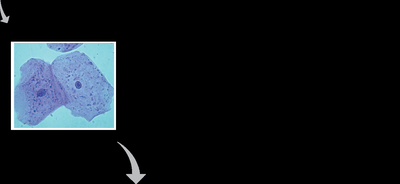
Cell: The fundamental unit of life.
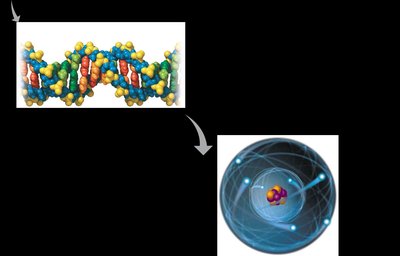
Molecule: Groups of atoms bonded together.
Atom: The smallest unit of matter.
The Process of Science
Scientific Inquiry and Method
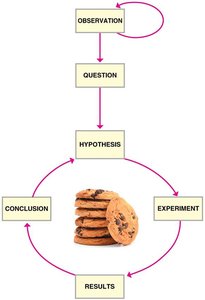
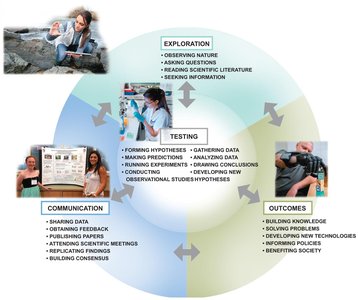
Science is an approach to understanding the natural world through inquiry. The scientific method is a systematic process used to investigate questions, gather evidence, and develop explanations.
Observation: Noticing phenomena or patterns.
Question: Asking about the cause or nature of the observation.
Hypothesis: A proposed explanation that can be tested.
Experimentation: Testing the hypothesis through controlled experiments or further observation.
Results: Collecting and analyzing data.
Conclusion: Interpreting results to support or refute the hypothesis.
Dissemination: Sharing findings with the scientific community.

Hypotheses, Theories, and Facts
Scientific Terms and Their Meaning
In science, a hypothesis is a testable and falsifiable explanation for an observation. A theory is a well-supported, testable idea based on objective data. A fact is a verifiable statement considered objectively true based on current evidence.
Hypothesis: Proposed explanation for a phenomenon; must be testable and falsifiable.
Theory: Broad explanation supported by extensive evidence; not "just a theory" but a robust scientific concept.
Fact: Objectively true statement based on repeatable evidence.
Scientific Law: A statement describing consistent natural phenomena, often expressed mathematically.
Experimental Design and Variables
Controlling Variables in Experiments
Controlled experiments are designed to test hypotheses by changing only one variable at a time. The independent variable is manipulated, while the dependent variable is measured. Control groups establish baselines for comparison.
Independent Variable: The factor being manipulated.
Dependent Variable: The response or effect measured.
Control Group: Baseline group; negative control expects no change, positive control expects a change.
Blind Experiment: Reduces bias by withholding information from participants or experimenters.
Placebo Effect: Improvement due to belief in treatment, not the treatment itself.
Data Collection and Communication
Using Tables and Graphs
Scientific investigations produce data, which are organized in tables and displayed visually in graphs. Bar graphs compare categories, line graphs show continuous change, and pie charts represent proportions.
Tables: Organize and share data.
Bar Graphs: Compare categories; error bars indicate variability.
Line Graphs: Show continuous data; axes labeled as x (horizontal) and y (vertical).
Pie Charts: Show proportions; total equals 100%.
Types of Scientific Studies
Controlled Experiments and Observational Studies
Hypothesis-driven controlled experiments allow scientists to test specific predictions. Observational studies are used when variables cannot be easily controlled, such as in ecology.
Controlled Experiment: Manipulates variables to test hypotheses.
Observational Study: Collects data without manipulation, often used in field research.
Critical Thinking and Pseudoscience
Evaluating Scientific Claims
Critical thinking is essential for evaluating scientific claims. Science is distinguished from pseudoscience by its adherence to the scientific method, repeatable results, testable claims, openness to review, and reliance on multiple lines of evidence.
Critical Thinking: Unbiased analysis and evaluation of information.
Pseudoscience: Falsely presented as scientific; lacks testability, repeatability, and openness to review.
Feature | Science | Pseudoscience |
|---|---|---|
Method | Established scientific method | Not accepted processes |
Results | Repeatable | Cannot be duplicated |
Claims | Testable, can be disproven | Unprovable, untestable |
Review | Open to outside review | Rejects external review |
Evidence | Multiple lines | Overreliance on limited data |
Evaluating Scientific Studies
Key Considerations
When evaluating scientific claims, consider sample size, control groups, and reproducibility. Reliable studies have large sample sizes, proper controls, and results that can be reproduced by others.
Sample Size: Number of subjects in each group.
Control Group: Provides confidence in variable tested.
Reproducibility: Results should be reproducible by other groups.
Sources of Scientific Information
Reliability and Peer Review
Different sources of information have varying degrees of reliability. Primary sources are original research, often peer-reviewed. Secondary sources review or describe primary sources. Peer review is the gold standard for scientific validity.
Primary Source: Original research, peer-reviewed.
Secondary Source: Reviews or descriptions of primary sources.
Wikipedia: Common first source, but editable by anyone.
Peer Review: Evaluation by impartial experts; ensures quality and validity.
Reliable Information: Current, primary, authored by qualified individuals, unbiased, reproducible, and peer-reviewed.
