 Back
Chapter 1 – The Study of Life and Graphing: Foundations of Biology
Study Guide - Smart Notes
 Tailored notes based on your materials, expanded with key definitions, examples, and context.
Characteristics of Living Organisms
Defining Life
Biologists identify several key characteristics that distinguish living organisms from non-living matter. Understanding these traits is fundamental to the study of biology.
Cellular Organization: All living things are composed of one or more cells, which are the basic units of life.
Metabolism: Living organisms carry out chemical reactions to obtain and use energy.
Homeostasis: The ability to maintain stable internal conditions.
Growth and Development: Organisms increase in size and undergo regulated changes over time.
Reproduction: The capacity to produce new individuals, either sexually or asexually.
Response to Stimuli: Organisms can detect and respond to environmental changes.
Evolution: Populations of organisms change over generations through adaptation and natural selection.
Major Biological Theories
The Cell Theory
The cell theory states that all living things are composed of cells, and that the cell is the fundamental unit of life. All cells arise from pre-existing cells.
The Chromosome Theory of Inheritance
This theory explains that genes are located on chromosomes, which are passed from parents to offspring during reproduction, providing the basis for inheritance.
The Theory of Evolution by Natural Selection
Evolution is the process by which populations of organisms change over time. Natural selection is the mechanism by which advantageous traits become more common in a population.
Evolution: Change in the genetic composition of a population over generations.
Natural Selection: The process where individuals with favorable traits are more likely to survive and reproduce.
Fitness: The ability of an organism to survive and reproduce in its environment.
Adaptation: A trait that increases an organism's fitness in a particular environment.
These terms are interrelated: natural selection drives evolution by favoring adaptations that increase fitness.
The Central Dogma of Biology
Information Flow: DNA to Protein
The central dogma describes how genetic information is transferred within a cell:
DNA is transcribed into RNA.
RNA is translated into protein.
The process can be summarized by the following equation:
Phylogenetic Trees and the Tree of Life
Understanding Relatedness
A phylogenetic tree is a model that depicts evolutionary relationships among species. The more recent the common ancestor (represented by nodes), the more closely related two species are.
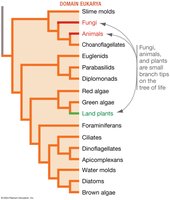
The Three Domains of Life
All life is classified into three domains:
Bacteria (prokaryotes)
Archaea (prokaryotes)
Eukarya (eukaryotes)
Prokaryotes lack a nucleus and organelles, while eukaryotes possess both. Organisms are further classified into Kingdom, Phylum, Class, Order, Family, Genus, and Species.
Scientific Naming of Organisms
Each species is given a unique Latin-based scientific name consisting of two parts: genus and species. For example, Homo sapiens (humans) and Saccharomyces cerevisiae (yeast).
The Scientific Method
Steps in Scientific Inquiry
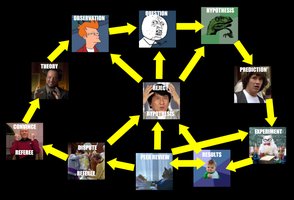
The scientific method is a systematic approach to answering questions and testing hypotheses.
Observation: Noticing phenomena in the natural world.
Question: Formulating a question based on the observation.
Hypothesis: Proposing an educated guess or explanation.
Prediction: Making testable statements (if-then).
Experiment: Designing and conducting tests with controls and variables.
Data Collection: Gathering and recording results.
Analysis: Interpreting data to draw conclusions.
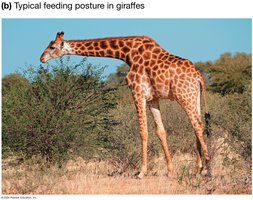
Example: Giraffe Neck Length
Question: Why do giraffes have long necks? Hypothesis: Long necks evolved to allow giraffes to reach food unavailable to other mammals (food competition hypothesis).
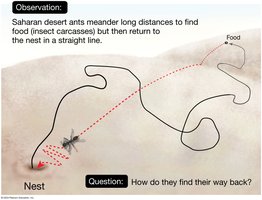
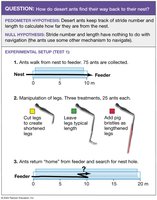
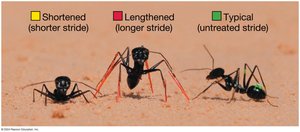
Example: Desert Ant Navigation
Hypothesis: Ants keep track of stride number and length to calculate their distance from the nest (pedometer hypothesis).
Experimental Design: Variables and Controls
Independent Variable: The factor manipulated by the experimenter.
Dependent Variable: The factor measured in response to changes in the independent variable.
Control Group: The group that does not receive the experimental treatment.
Treatment Group: The group(s) that receive the experimental treatment.
Introduction to Graphing
Axes and Data Types
Graphs are essential tools for visualizing scientific data. The Y-axis is vertical, and the X-axis is horizontal.
Discrete Data: Countable, distinct items (e.g., number of students).
Continuous Data: Infinite values, typically measurements (e.g., height, time).
Categorical Data: Distinct groups or categories (e.g., species, location).
Common Types of Graphs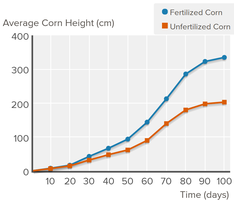
Line Graph: Displays changes in a dependent variable over time; continuous data on both axes.
Scatter Plot: Shows relationships between two variables; continuous data on both axes; trendlines indicate correlations.
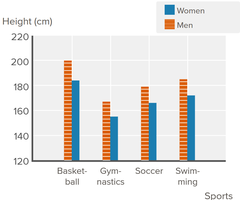
Bar Graph: Compares groups; categorical independent variable, continuous dependent variable; often includes statistics like mean and standard deviation.
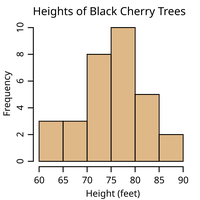
Histogram: Shows distributions of continuous data; data binned into groups, frequencies on the other axis.
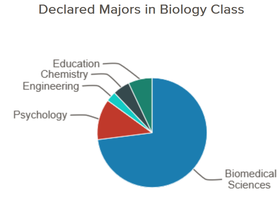
Pie Chart: Displays percentages or fractions of a whole; each category is a slice.
Features of a Good Graph
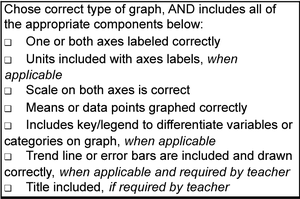
A good graph should include:
Correct type of graph for the data
Axes labeled correctly
Units included with axes labels
Correct scale on axes
Means or data points graphed correctly
Key/legend to differentiate variables or categories
Trend line or error bars when applicable
Title included if required
Correlation vs. Causation
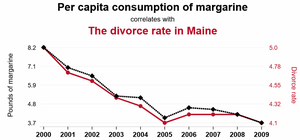
Correlation indicates a relationship between two variables, but it does not prove that one causes the other. Spurious correlations can occur by chance and should be interpreted with caution.
Summary Table: Types of Data and Graphs
Data Type | Best Graph Type | Example |
|---|---|---|
Discrete | Bar Graph | Number of students in each major |
Continuous | Line Graph, Scatter Plot, Histogram | Height over time, distribution of test scores |
Categorical | Bar Graph, Pie Chart | Species, location, material type |
